

Static thresholds work well when you already know what a failure looks like. Disk above 90%, service unreachable, error counter above zero — these are clear conditions, easy to express as a rule, and NetXMS has handled them since its first release. The harder case is the metric with no obvious “bad” number.
Like an interface that carries 200 Mbit/s on weekdays and almost nothing on weekends. To set a static threshold on that, you first have to know what normal is — and for most of the metrics in a real installation, nobody has ever measured it. The threshold ends up being a guess, set loose enough not to generate noise, which means it also misses everything short of a hard failure.
That is the gap anomaly detection is meant to close. This year, we introduced LLM-guided anomaly detection in NetXMS: instead of asking the administrator to define normal, the system derives it from each metric’s own history and flags behaviour that does not fit.
Three tiers, one framework
Anomaly detection is the practice of identifying metric behaviour that deviates from an established baseline. Before diving into the AI layer in NetXMS, it helps to understand where it fits.
NetXMS offers three distinct tiers of anomaly detection, each with different capabilities and trade-offs:
Statistical thresholds are the oldest and simplest tier. They use built-in statistical functions (mean deviation, absolute deviation) to flag values that fall outside expected ranges. No training required, no machine learning, no external calls. They have been part of NetXMS for years and remain useful for catching straightforward deviations quickly.
Isolation forest is a machine learning algorithm that requires a training period to build a model. It is more sophisticated than pure statistics and can identify anomalies in multidimensional data, but it comes with a processing cost: each incoming value needs to be run through the algorithm in real time.
LLM-based detection is the newest and most capable tier. It combines the pattern-recognition power of large language models with a lightweight runtime architecture. The intelligence lives in a precomputed profile; the actual detection at runtime is just fast C code.
All three can be used independently or in combination on the same DCI. The choice depends on your environment, your compute budget, and how sophisticated your anomaly detection needs to be.
How LLM-based detection actually works
The architecture is split into two clearly separated phases: profile building and runtime evaluation.
Phase 1: Building the profile
Once you enable AI-based anomaly detection on a DCI, NetXMS takes the last 30 days of historical data for that metric and passes it through a statistical engine. This engine calculates a range of statistical parameters. Not just the data itself, but its shape, rhythm, and patterns over time.
That statistical dataset, along with metadata about the DCI (its name, the metric it represents, the node it belongs to), is then sent to an LLM. The model’s job is to analyse this information and build a detection profile — a structured description of what “normal” looks like for this specific metric.
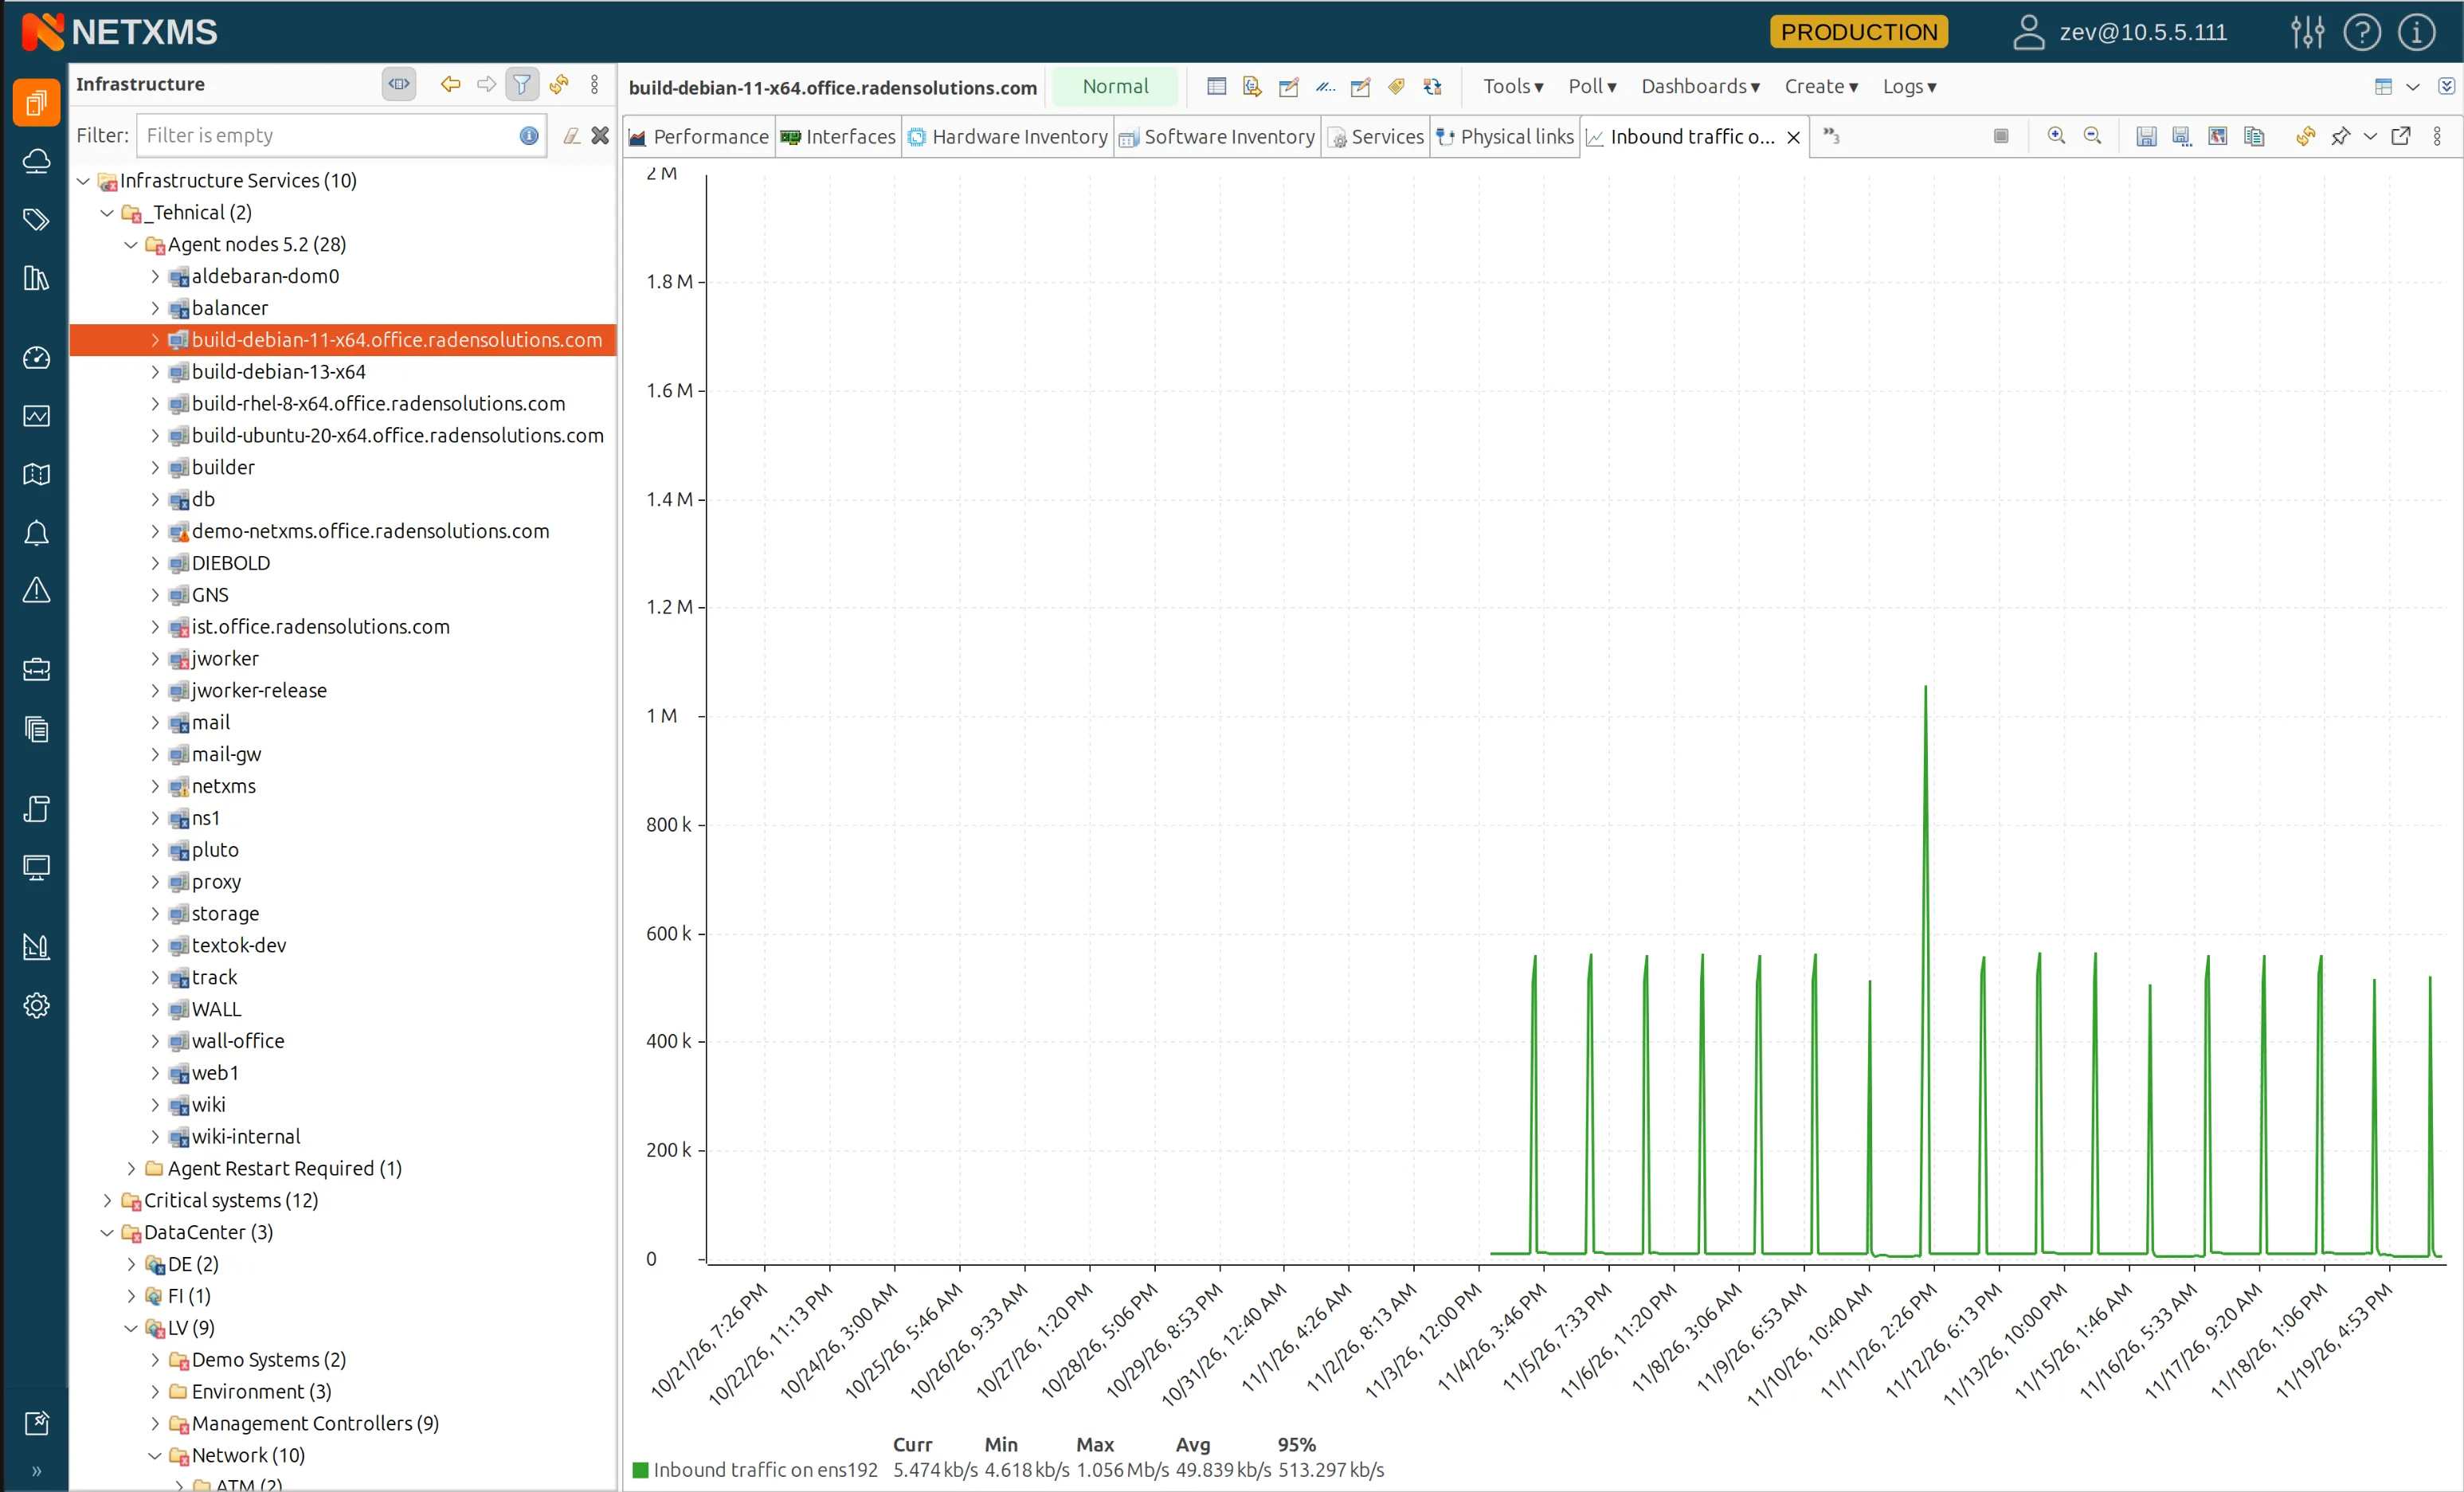
The profile isn’t a black box. It’s a collection of named detection methods that the LLM selects and parameterises based on what it finds in the data:
- Hard bounds — absolute minimums and maximums that should never be crossed under any circumstances
- Seasonal deviation — expected variation by time of day and day of week (for metrics with regular weekly or daily rhythms)
- Expected rate of change — to catch sudden spikes or drops in metrics that normally change gradually
- Sustained high / sustained low — detection of prolonged periods above or below the established baseline
- Sudden drop — comparison of the current value against an exponential moving average, to catch sharp unexpected falls
The LLM decides which of these methods to include and how to configure them based on the actual behaviour of the data. A metric with strong daily seasonality will get a different profile than one that’s flat and uniform. A metric prone to occasional spikes will have its rate-of-change parameters tuned accordingly.
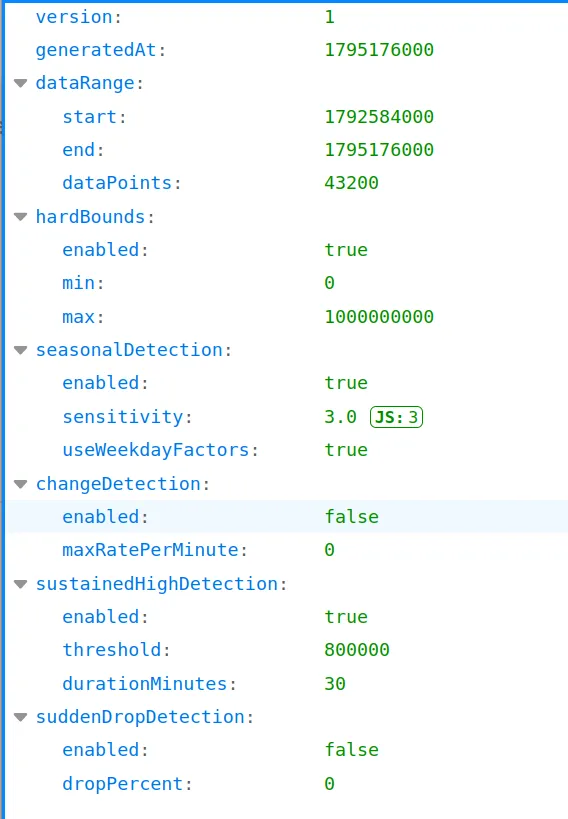
Profile generation runs as a scheduled task (by default once a week) so profiles stay current as behaviour evolves. You can also trigger profile generation manually at any time.
Phase 2: Runtime evaluation
Once a profile exists, the LLM is completely out of the picture at runtime. Every new DCI value is evaluated against the precomputed profile using a profile evaluator written in C code, that means no external API calls or database queries, and no ML model inference.
If the evaluator flags a value as anomalous, it triggers an event, which can then drive an alarm through the standard event processing pipeline. From the operator’s perspective, it looks and behaves exactly like any other NetXMS alarm.

This two-phase design is a deliberate architectural choice. The expensive, intelligent work happens offline during profile building. The cheaper, fast work happens continuously at runtime. Thus, you get the benefit of AI-level pattern recognition without paying the latency or compute cost on every data point.
Teaching the AI about your environment
Statistical data alone doesn’t tell the whole story. An LLM analysing 30 days of CPU utilisation has no way of knowing that every Sunday night at 2 AM a backup job causes a predictable spike, unless you tell it.
NetXMS lets administrators provide custom hints at two levels: the DCI level and the node level.
Node-level hints apply context to all metrics on that node. Useful for operational facts the LLM can’t infer from numbers. DCI-level hints apply to a specific metric, like spikes during hourly backup jobs that are expected, or counter resets at midnight that are counted as normal behaviour.
These hints are plain-text descriptions that get passed to the LLM during profile building, giving it contextual information it couldn’t infer from statistics alone.
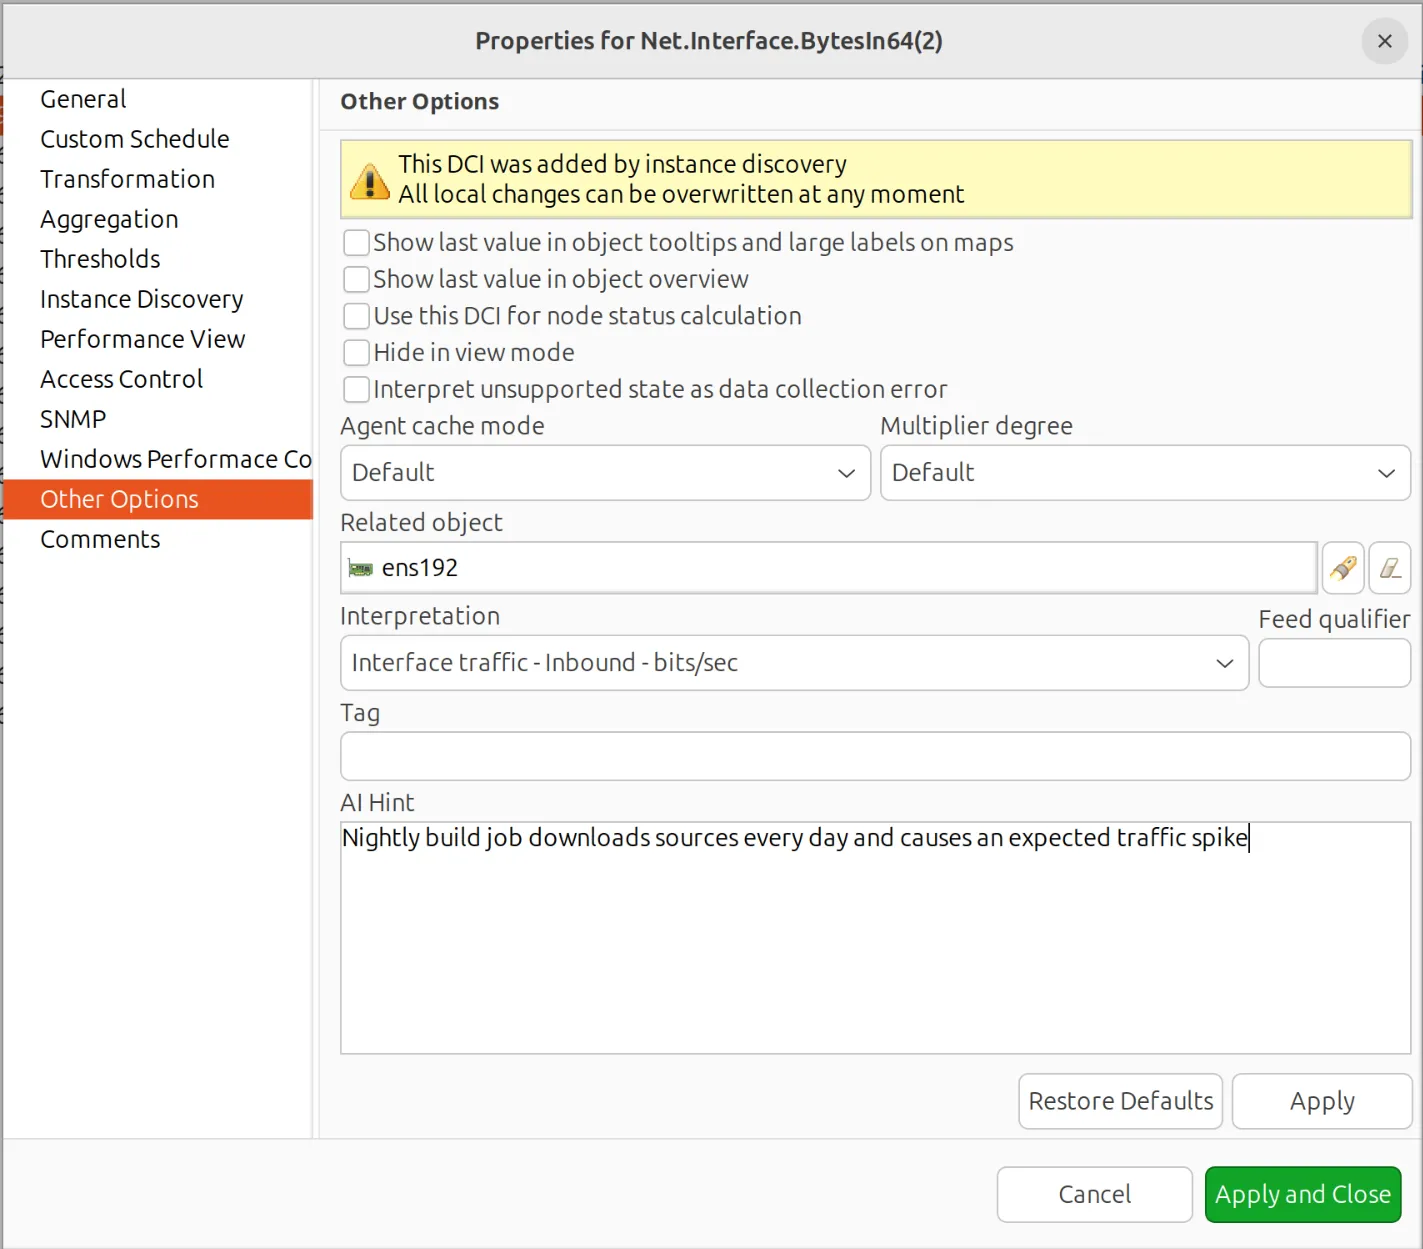
Useful hints might include:
- Maintenance windows and scheduled tasks that cause expected deviations
- Known load patterns tied to business cycles
- Normal operational ranges that differ from what the raw numbers might suggest
- Environment-specific context (e.g. “this is a development node with irregular usage patterns”)
Good hints reduce false positives. They help the LLM build a profile that reflects reality rather than just the numbers — and the difference can be significant in environments with complex, non-uniform behaviour.
Configuration: what you actually need to set up
Getting AI anomaly detection running in NetXMS requires a few straightforward steps.
1. Configure an LLM provider. NetXMS uses a slot-based system for AI providers. Anomaly detection uses the analytical slot. If that’s not filled, it falls back to the default slot. Supported providers include OpenAI (including compatible providers like OpenRouter), Ollama, and, as of the latest release, Anthropic. Each provider is configured with its endpoint and credentials and assigned to one or more slots.
2. Enable AI anomaly detection on the DCI. In the DCI configuration, under the Thresholds tab, check “Detect anomalies using AI.” The system will queue that DCI for profile generation on the next scheduled run, or you can trigger it immediately.
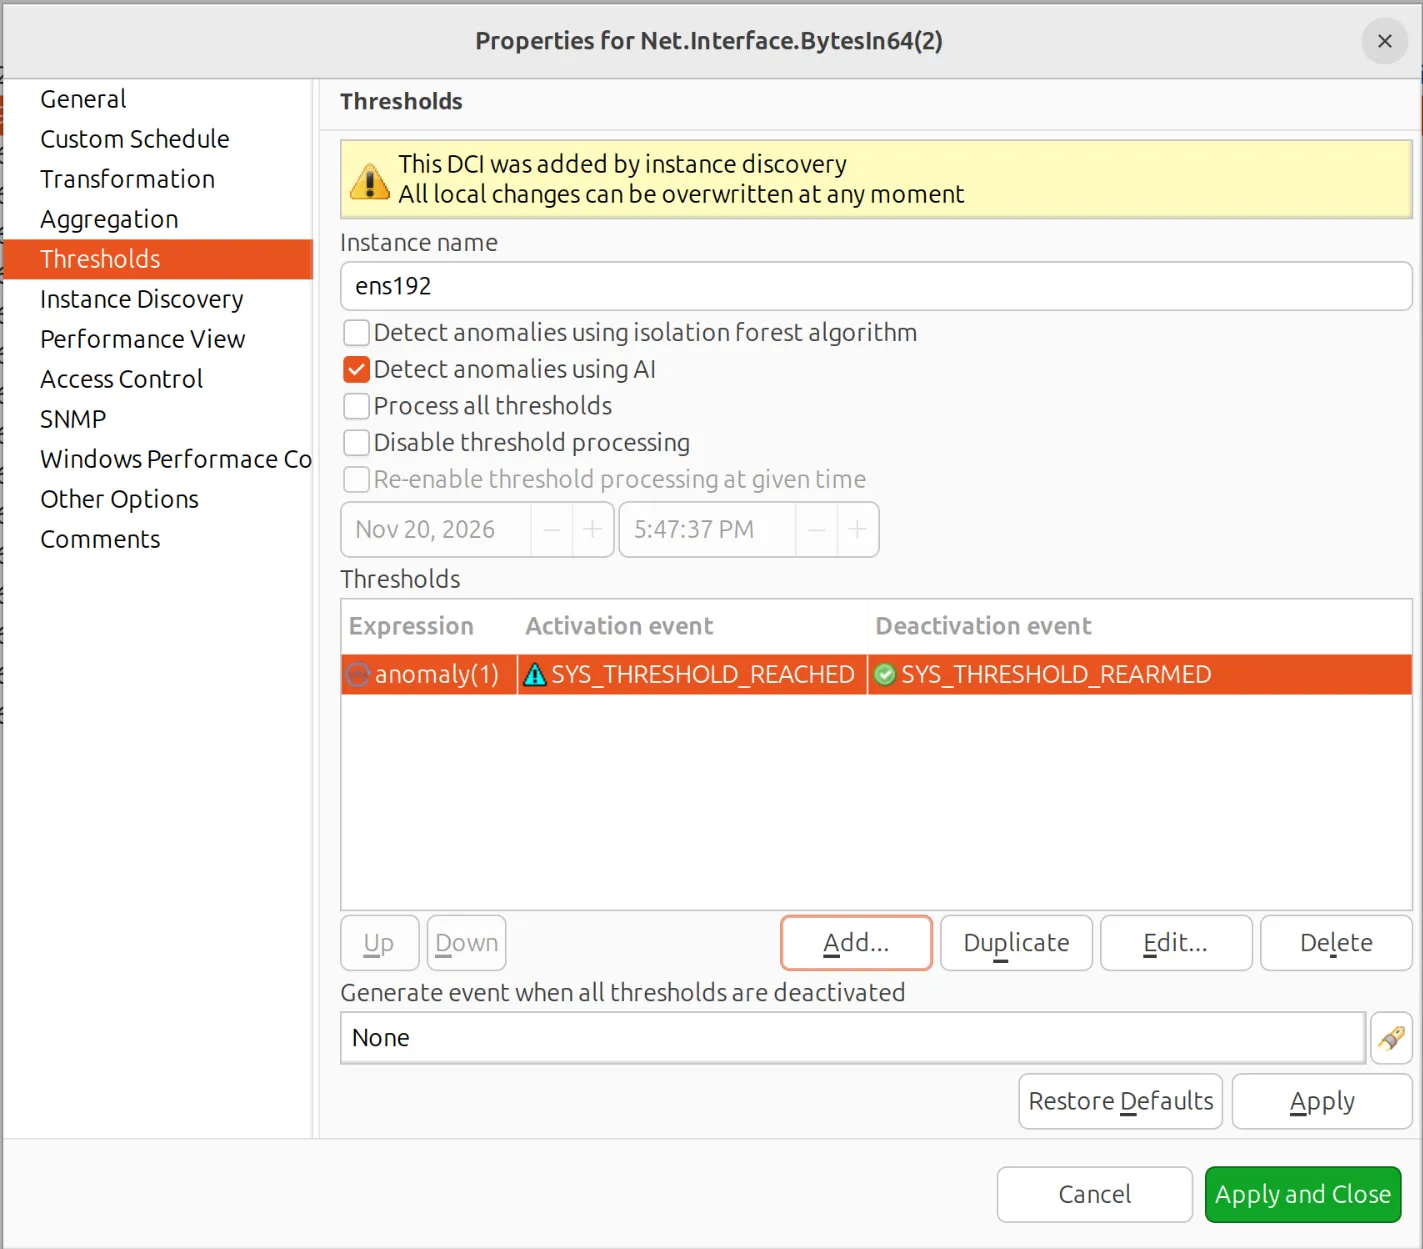
3. Add an anomaly threshold. This works like any other NetXMS threshold, but instead of specifying a value or function, you select the special anomaly function. One sample is sufficient — when the profile evaluator flags an incoming value, the threshold fires and your configured event is triggered.
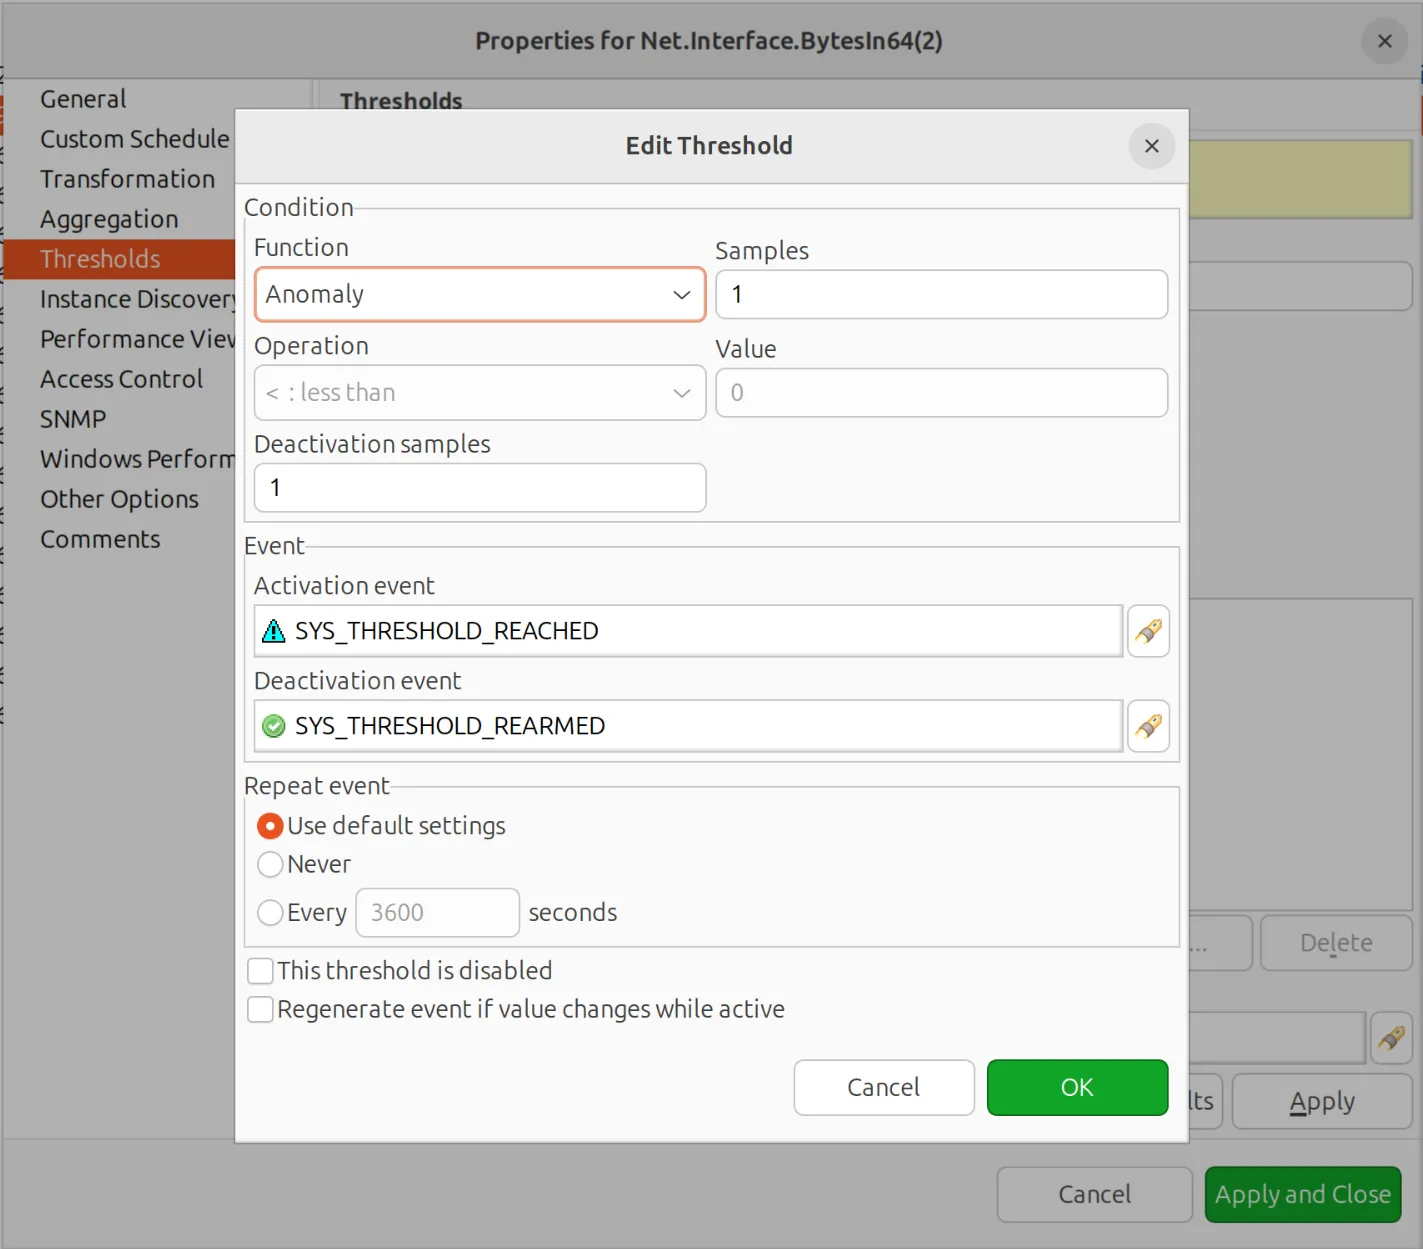
That’s the complete setup. The ongoing maintenance is minimal: profiles regenerate weekly by default, and you can update hints at any time.
Combining detection methods
One question that comes up immediately: can you run both isolation forest and LLM-based detection on the same DCI? Yes — whichever method fires first triggers the anomaly threshold.
The practical consideration is compute cost. LLM-based detection is computationally intensive during profile building but very lightweight at runtime.
Isolation forest inverts this. It’s cheaper to train but requires running each new value through the algorithm in real time. Running both gives you broader coverage at the cost of slightly higher per-value processing overhead.
For critical metrics where false negatives are costly, that trade-off is often worth it.
What this looks like in practice
Almost every anomaly below could be caught by a static threshold, provided someone already knows the right number. That is precisely the problem.
Finding the right number means opening a history graph for each metric on each node, working out what that particular object normally does, and translating it into a rule. It is exactly the analysis the profile builder performs automatically, on every enabled DCI, every week.
A jump that holds. A production router normally runs at 3–4% CPU, with occasional legitimate spikes to 15%. An unexpected process pushes utilisation to 85% and keeps it there. A static threshold at 20% would have caught this, but 20% is only obviously the right figure once you have studied this router’s history. On the firewall next to it, 20% is absolutely normal; on an application server, it may be idle.
There is no single number you can push out to every node, and hand-tuning one per DCI does not scale past a few dozen metrics. The profile derives the bounds from the metric’s own 30-day history, and the sustained high detector flags the deviation.
A drop that stays inside the bounds. A metric that should always show traffic falls to zero. Nothing in a conventional “must not exceed X” threshold catches this. And defining a lower bound requires knowing what the floor should be — a number that changes per interface, per time of day, and after every topology change.
The sudden drop detector compares the incoming value against an exponential moving average and flags the fall regardless of where the absolute bounds sit.
A normal value at an abnormal time. A batch server at 90% CPU at 3 AM is doing its job. The same 90% at another time means something is wrong. No single static threshold can express both, because the value alone carries no information — only the value together with the time does.
The seasonal deviation detector stores a separate baseline for each hour of the day, plus weekday and weekend factors, so the same reading can be normal in one window and anomalous in another.
The common thread is not that these conditions are undetectable. It is that detecting them with static rules requires prior knowledge of normal for every metric you care about — knowledge that has to be produced by hand, kept current, and repeated across your entire infrastructure. AI profile-based detection produces that knowledge from the data you are already collecting.
A note on data and security
NetXMS doesn’t send raw metric values to the LLM. What gets transmitted during profile generation is the statistical summary computed locally — means, deviations, rate-of-change statistics, and metric context.
AI-powered anomaly detection is disabled by default and must be explicitly enabled per DCI. To prevent any anomaly-related data transmission entirely, simply don’t enable it on any metrics. For environments where data must not leave the perimeter at all, Ollama allows the whole profile-building step to run on local infrastructure.
New functionality overview in 2026
The anomaly detection engine is part of a broader AI strategy in NetXMS. The same provider infrastructure powers the AI Assistant, automatic alarm comments, the guard model for prompt injection protection, and interactive AI chat — all using the same slot system, all configurable per provider and model.
What you will love: a completely new Web UI and OpenTelemetry support (metrics and logs, working both ways), along with a very long list of improvements that came in this year’s second major release this October.
Oxidized integration for configuration backup, in-tool configuration backup, as well as integration with ntopng came in NetXMS 7. It now allows for NetFlow functionality with NetXMS.
If you’re running any version of NetXMS that is no earlier than six, AI-based anomaly detection is available there. The best way to understand what it can do for your environment is to enable it on a handful of your most behaviourally complex metrics, let it build profiles, and see what it catches.
Our team is looking for feedback on what works, what doesn’t, and where the detection logic could be improved. This is a feature that will get significantly more capable over time, and real-world input from operators is a big part of how that happens.
Have questions about configuring AI anomaly detection in NetXMS? Visit the NetXMS documentation or join the discussion on the community forum.