

Choosing an infrastructure monitoring platform comes down to a checklist. It’s the list of things your environment actually needs, and how many of them a given tool handles without a workaround. We see that checklist in every demo.
Someone from the network team asks about LLDP discovery, someone from applications asks about OpenTelemetry, someone from the OT side asks about Modbus, and someone from finance asks what happens to the bill when the estate doubles.
The platform that gets picked is rarely the one that does a single thing best. It’s the one that answered “yes” the most times.
Here are several dimensions those questions cluster around, and where we think NetXMS comes out ahead.
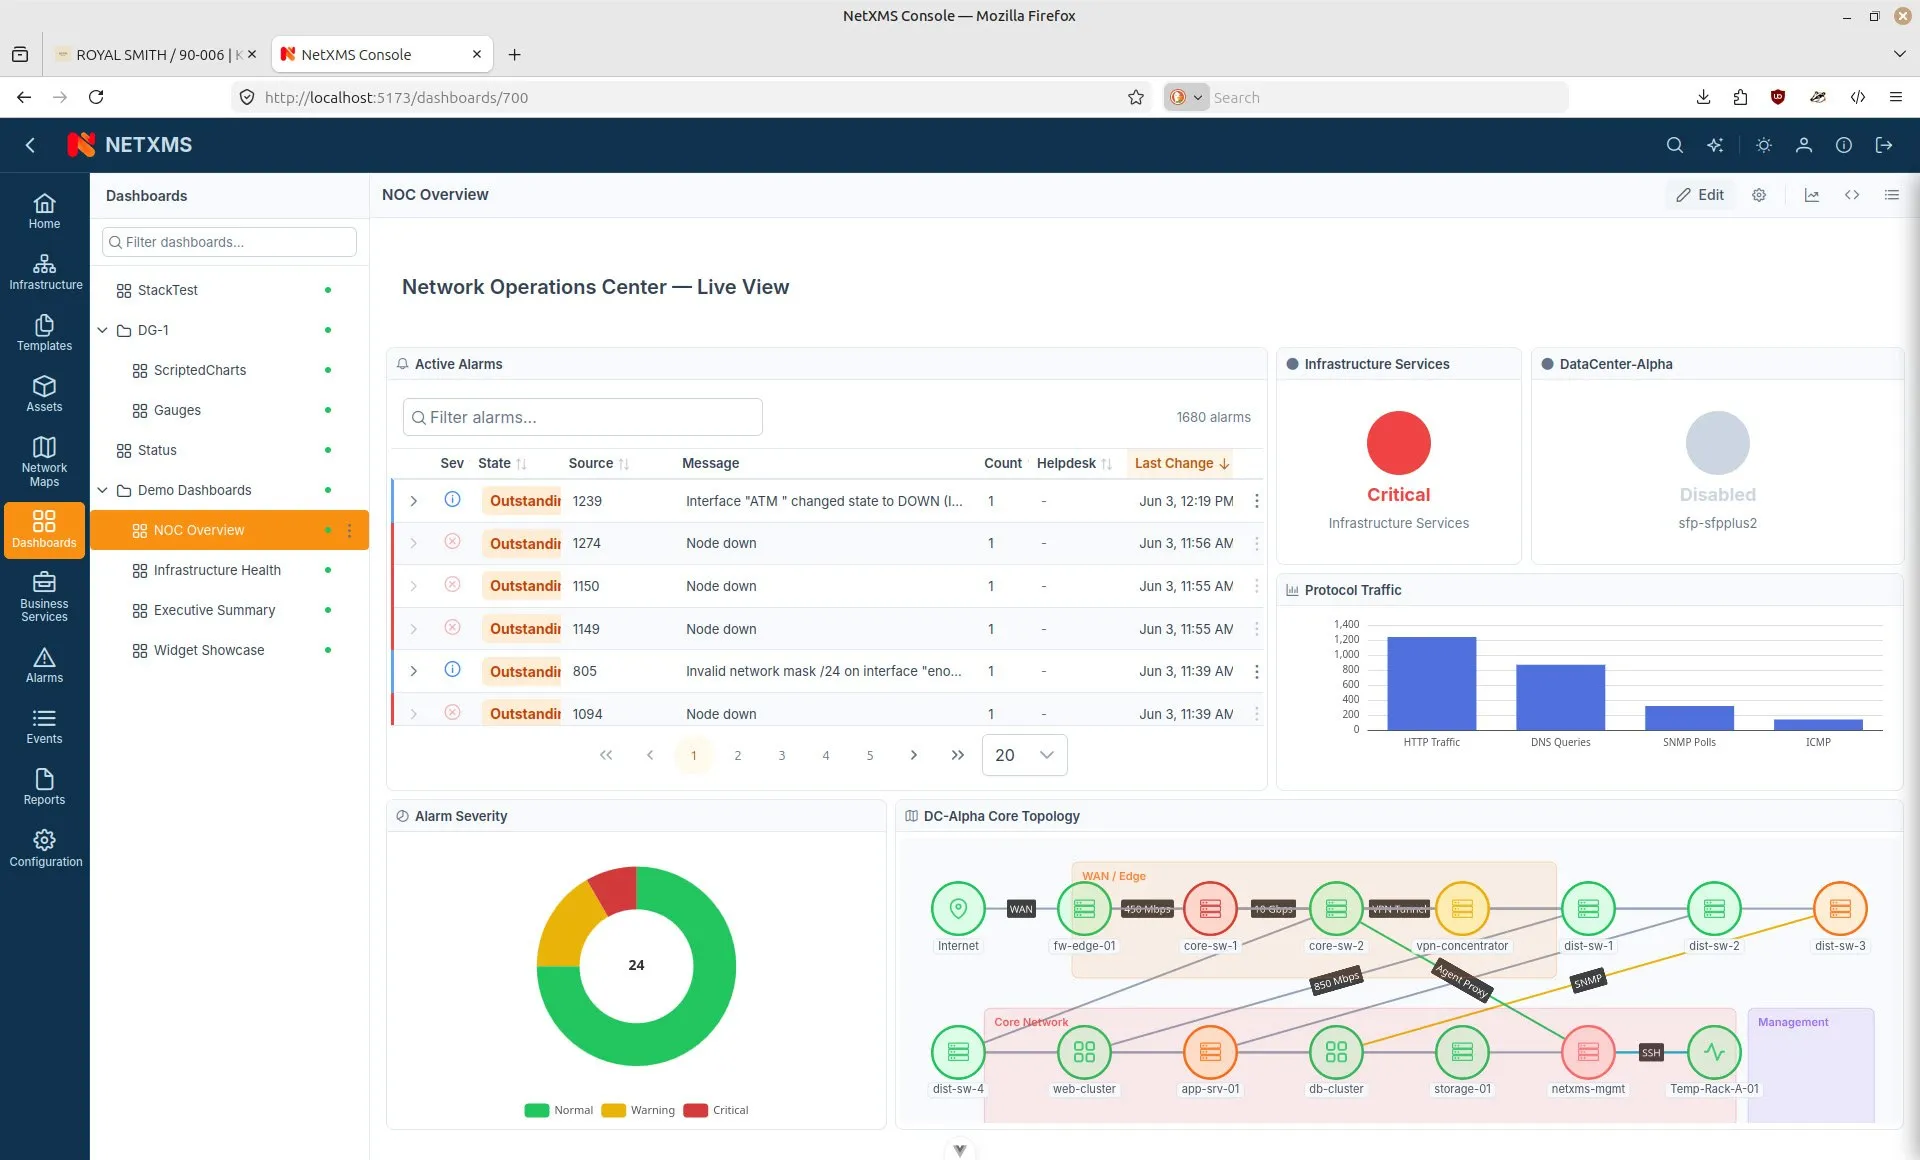
Breadth wins
Trust us, when we say that there are no two infrastructures that look alike. A regional bank has ATMs (including some old ones, still running on Windows XP), a payment switch, and a Windows estate. A utility has SCADA and RTUs. A university has everything, built over thirty years, with nobody left who remembers half of it.
A tool that covers one layer brilliantly still loses, because every “no” in a demo is a second product the client has to buy, integrate and staff.
NetXMS collects through SNMP v1/v2c/v3, ICMP, SSH, native agents, web services, JMX and MQTT. It ingests syslog, Windows Event Log and application logs parsed at the source. On the industrial side it speaks Modbus-TCP, OPC UA and EtherNet/IP.
So IT and OT land in the same event pipeline instead of two consoles that nobody correlates.
And it really matters. Plenty of organisations run a network tool and a separate industrial one, and discover during an incident that neither of them knows what the other saw.
The capabilities that become an additional tool
Configuration backup is the clearest example. Most teams end up running something separate to pull and version switch, router and firewall configs. NetXMS keeps that inside the platform.
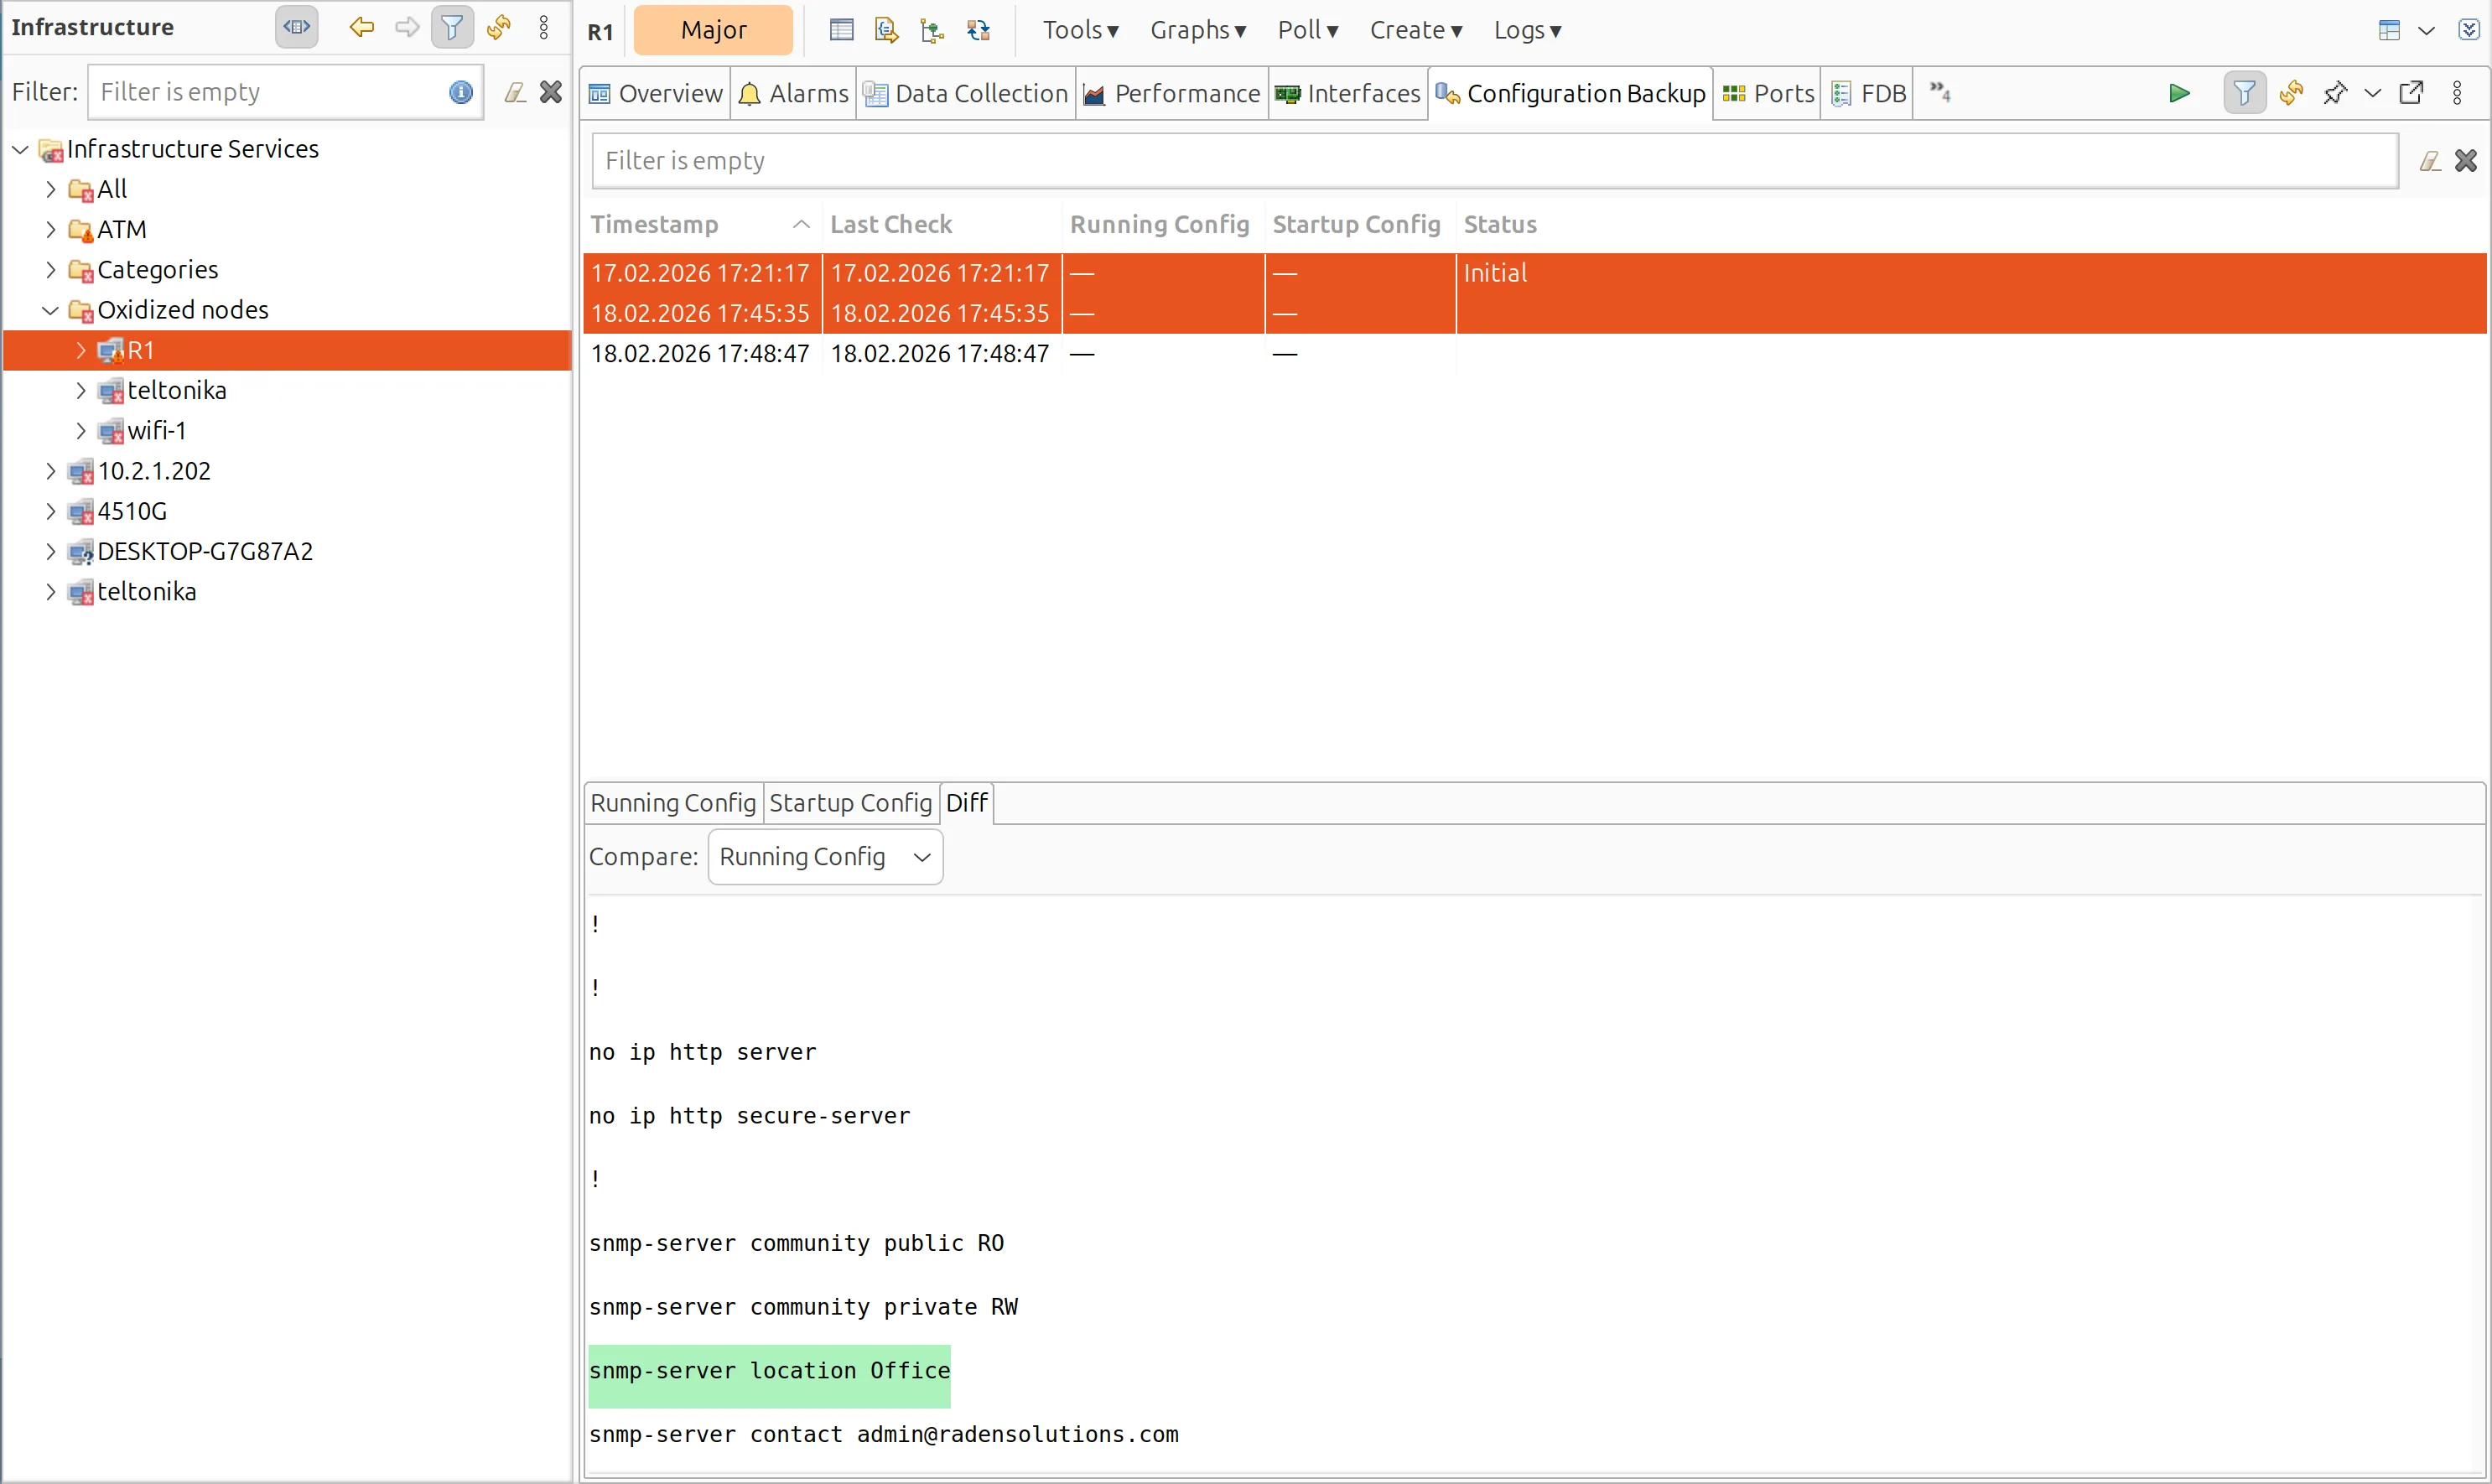
Device configurations are collected on a schedule, versioned, and diffed against previous revisions, attached to the same node objects, under the same permissions, in the same console as the alarms.
As a result, “someone changed this config at 14:15” sits two clicks apart instead of two systems apart. The AI assistant can pull and compare revisions as part of an investigation, so that correlation doesn’t depend on an operator thinking to check.
It’s a mundane capability. It’s also one that most monitoring platforms, open-source and commercial alike, leave to a bolt-on.
The price conversation has changed
Commercial monitoring vendors have been raising prices, and the effect on our inbound has been obvious. There are more evaluations for monitoring platforms that start from open-source solutions with professional support attached, rather than from a shortlist of proprietary suites.
The argument isn’t really “free”. Nobody running critical infrastructure picks software because it costs nothing.
The argument is predictability. Per-sensor, per-metric and per-seat licensing means the bill moves every time the estate grows. And growth is the one thing you can count on in a successful company. Adding a rack of switches shouldn’t require a procurement conversation.
NetXMS is open-core, it has a fully functional Community version. Commercial support is a fixed annual tier, not tied to the number of proxies. And NetXMS Enterprise Edition adds modules that some organisations need and many don’t. That’s how we fund the open-source work.
What you get out of that model is the ability to size the commercial relationship to what you actually need, and to adjust it later when you need it.
Adding new technology
Almost every vendor’s website now mentions OpenTelemetry and AI. The useful question is whether either one is shipping.
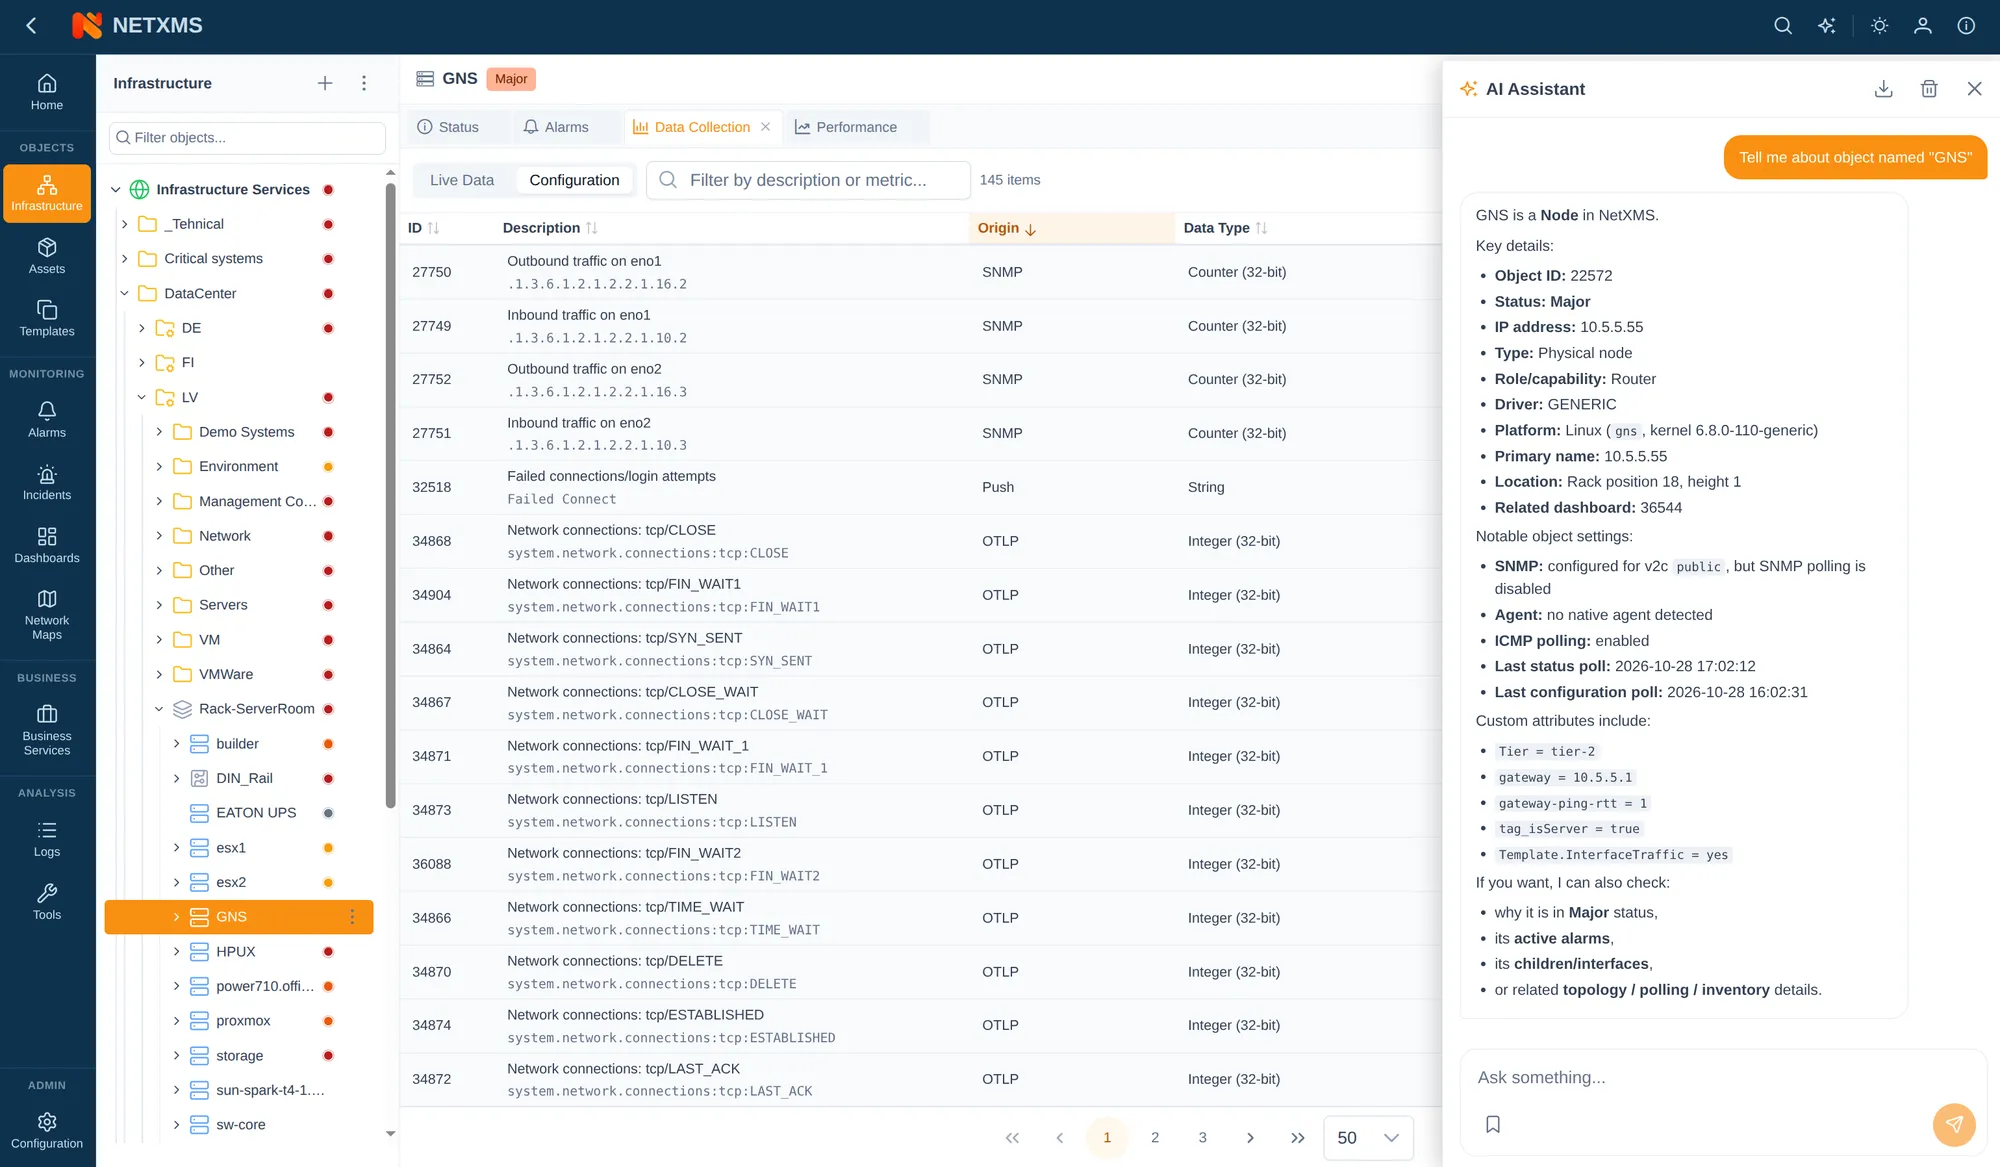
OpenTelemetry — which direction the data flows?
OpenTelemetry is a vendor-neutral standard for collecting metrics, logs and traces from instrumented applications. Nearly every observability product supports it in some form. But “support” splits into two very different things.
Some tools only export their own data over OTLP to somewhere else. That’s useful, and it also means the real console ends up being whatever backend receives the feed. The monitoring tool becomes a feeder.
NetXMS speaks OTLP in both directions (read a technical article on OTel support in NetXMS here).
Ingesting. Metrics and logs from applications instrumented with standard OpenTelemetry SDKs arrive directly, map onto monitored nodes by resource attributes, and feed the same alarm pipeline as everything else.
Log severity becomes event severity, so an error from a containerised payment service and an SNMP trap from the switch underneath it hit the same policy engine, on the same node object, at the same moment.
Metric attributes become data collection instances automatically, with a browsable catalogue of what each application has actually pushed.
Exporting. NetXMS also pushes its own events, metrics and logs out over OTLP to any compatible backend. That matters because most organisations aren’t starting from zero — there’s usually a Grafana estate, a SIEM, or a corporate collector that every team is expected to feed, and the people running it don’t want a second pane of glass.
NetXMS can be the system of record for the network, the servers, the ATMs and the OT controllers — the things generic observability platforms handle poorly or not at all — and still deliver a clean, standard-format feed upward to whatever the wider organisation standardised on.
Event forwarding is an Event Processing Policy action, so the filtering vocabulary you already use decides what exactly leaves the server.
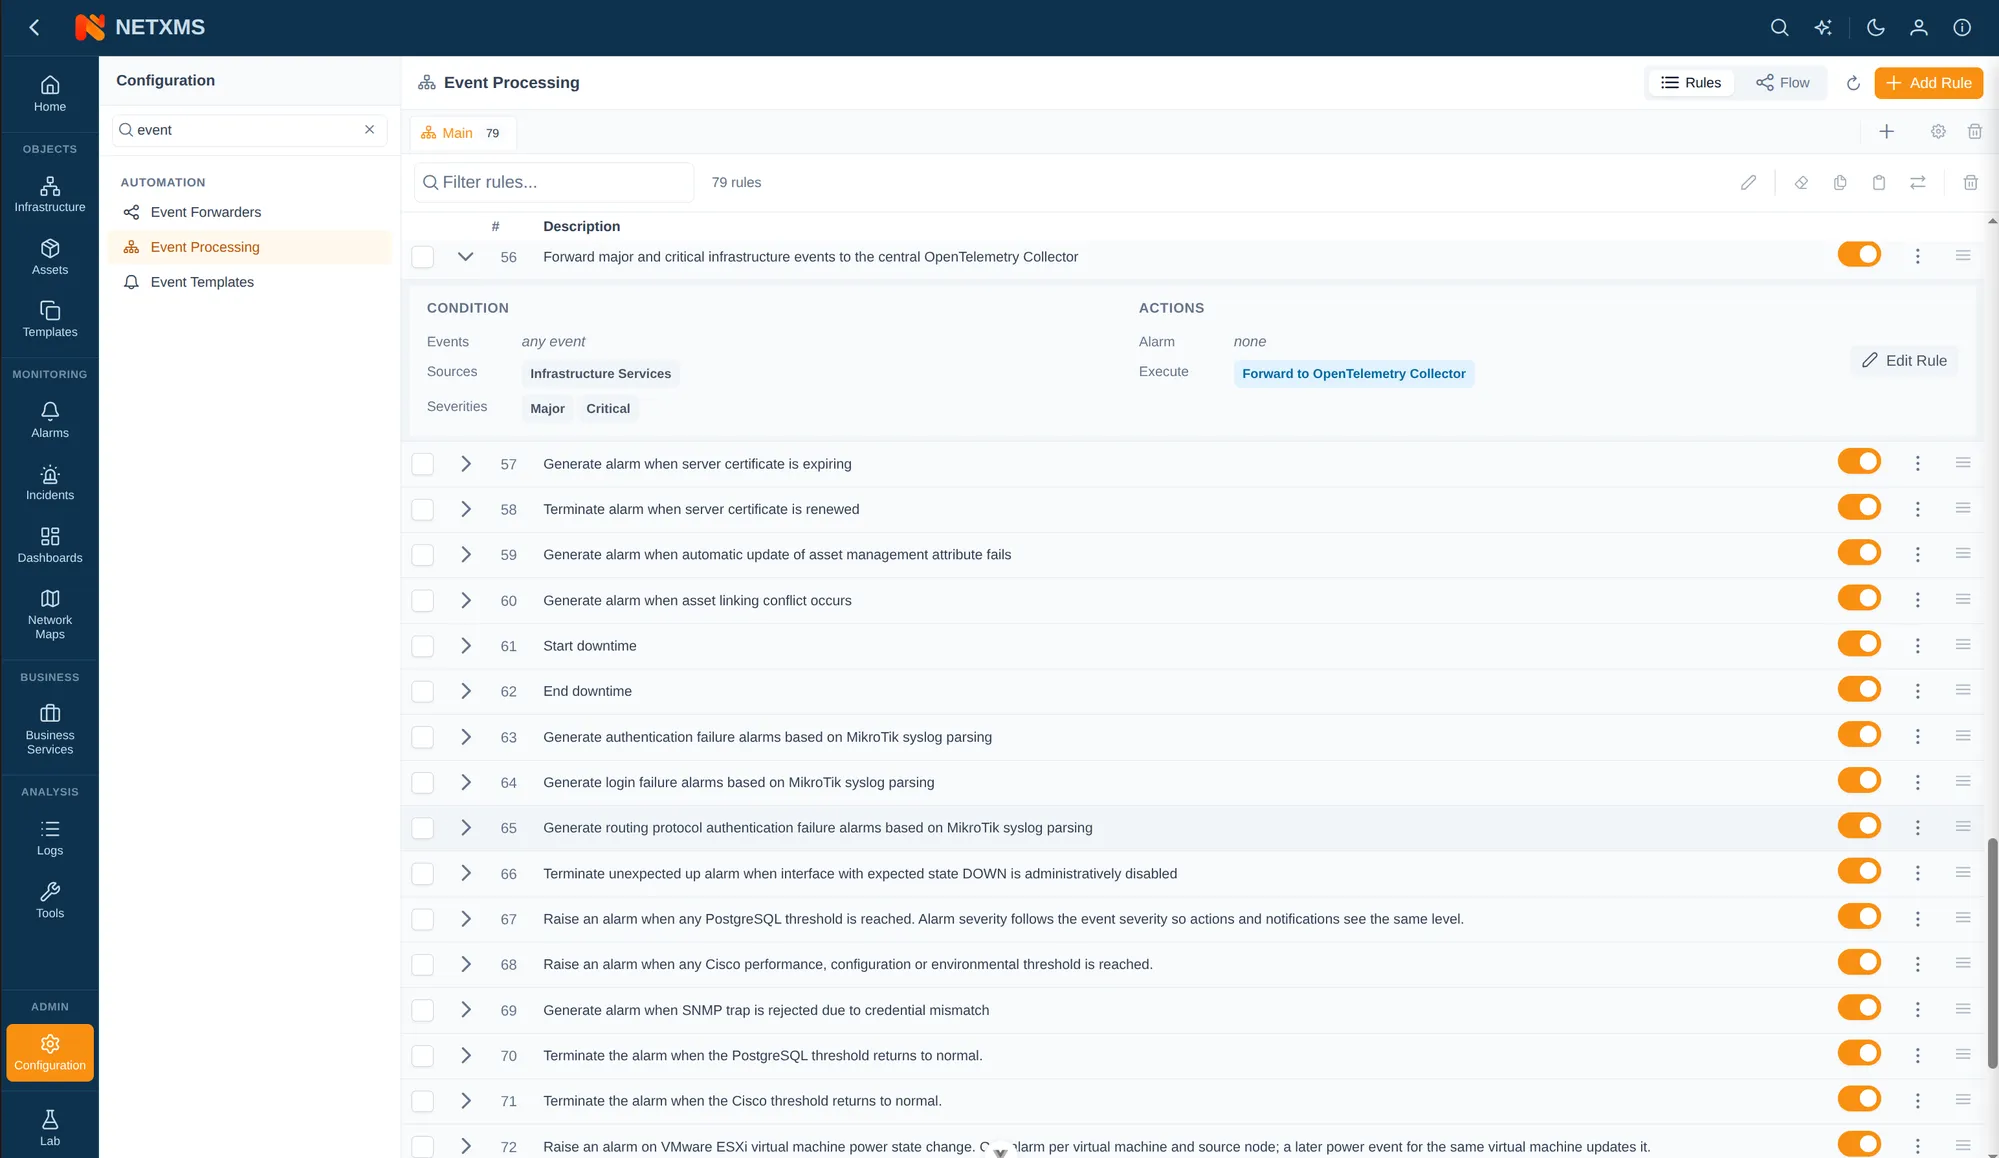
Practically, that means one console and one set of correlation rules covering the switch, the server and the application running on it. Without cutting you off from the stack the rest of the business already uses.
AI that explains the platform to you and acts
The AI layer does two distinct jobs, and the second one gets underrated.
The first is operational. AI Operators are persistent autonomous instances, each with its own scope filter, instructions, execution interval and daily token budget.
You can run several with different remits: one watching the ATM fleet, one on batch windows, one on capacity trends. Configured well, it starts to resemble a shift roster rather than a feature.
They run under a dedicated service account that can’t log in and holds read-only rights by default, so what an operator can see is an ordinary permissions question. There’s a global kill switch, a per-instance one, and automatic disabling after repeated failures.
Where read-only data isn’t enough, the AI can run CLI commands over SSH. Every command is classified before execution against platform-specific pattern databases covering Linux and six network vendor platforms.
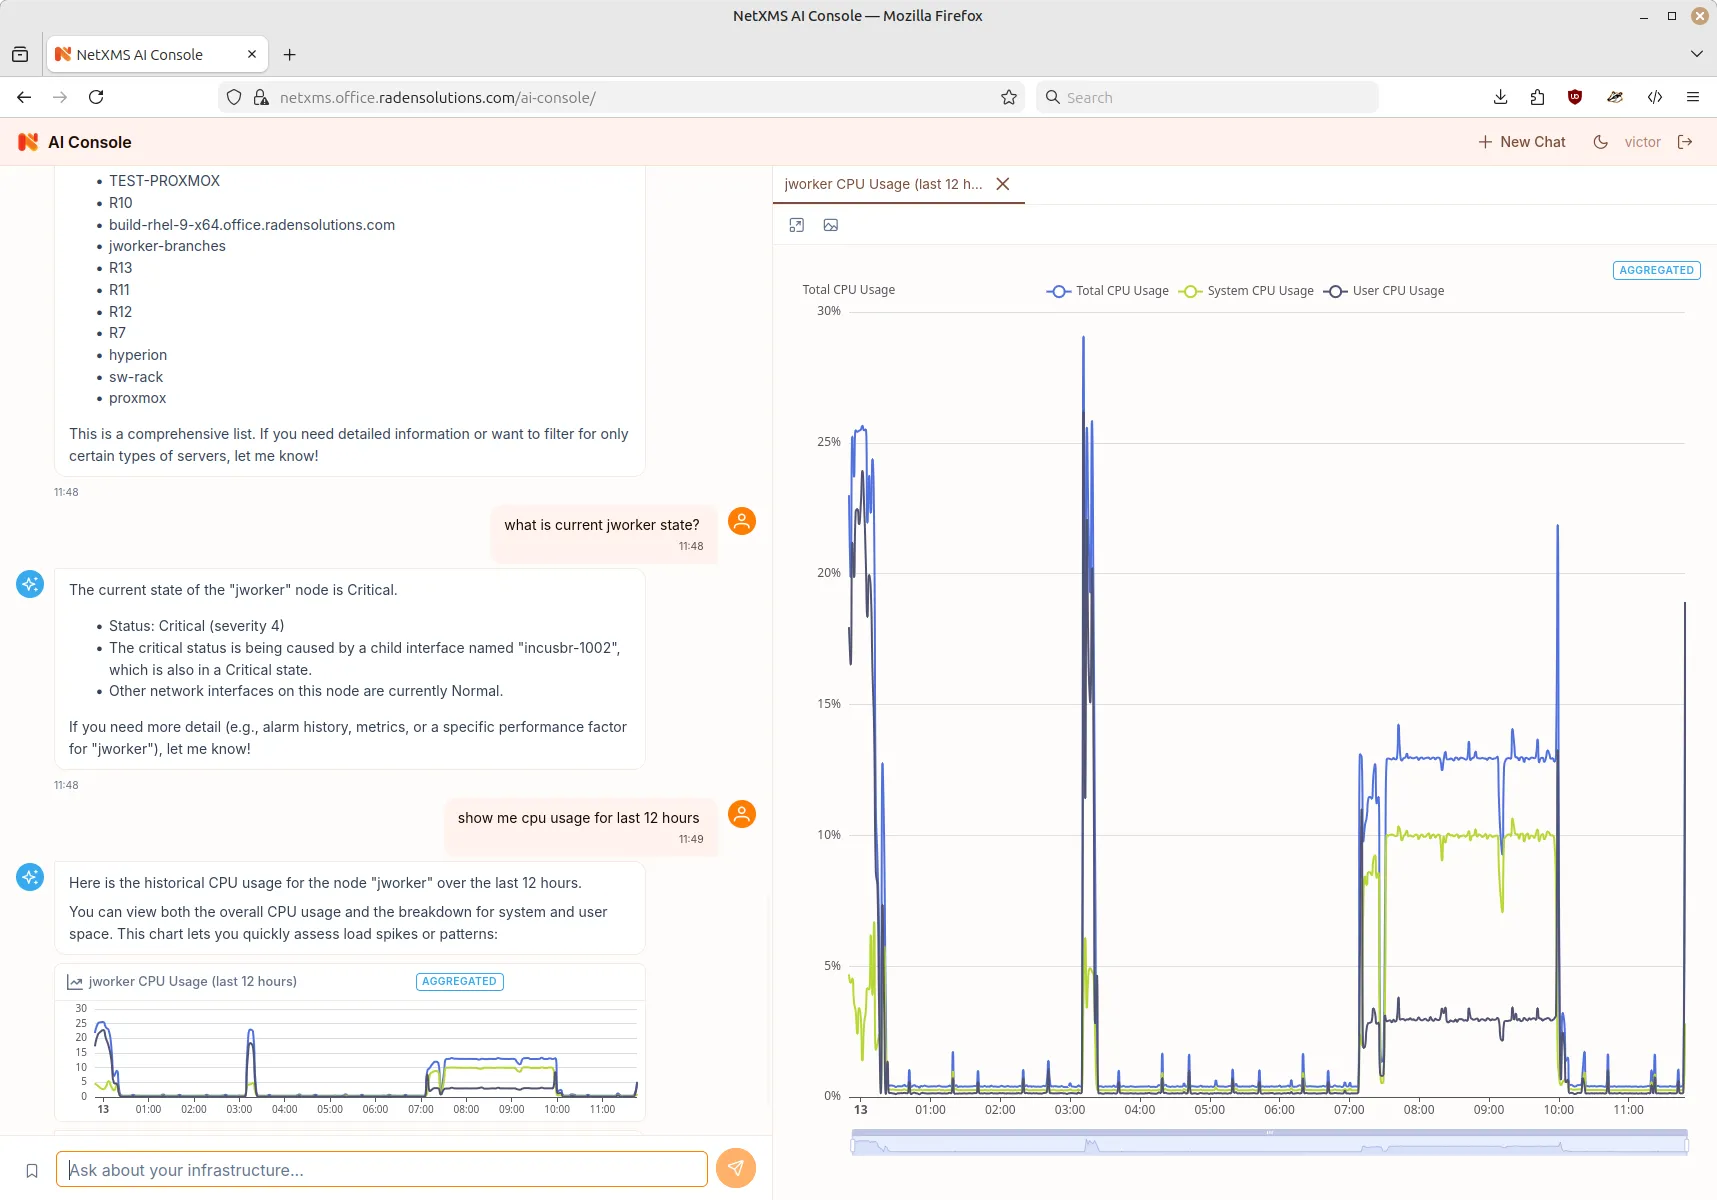
Read-only commands run immediately, write commands require explicit human approval, and destructive ones are blocked outright with no override. Everything lands in an audit table with the command, the intent, the approver and the result.
The second job is knowledge. NetXMS is a deep platform, and depth has a cost. There’s a lot to learn, and the answer to “how do I configure this” has historically been documentation, the forum, or a support ticket.
Now it’s a question in the console. The assistant knows the platform’s own concepts, so a new administrator can ask how to build a threshold with hysteresis, or have a data collection item created for every Cisco router and shown to them before it’s applied.
For teams onboarding staff onto a large deployment, that’s the difference between weeks and days.
On licensing, to be explicit: the AI assistant and its core skills ship with the Community version. The enterprise AI extensions — topology analysis, NXSL script execution, AI-driven SSH — are part of Enterprise Edition and licensed separately.
Architecture today is a feature too
Scalability is usually presented as a number. A single NetXMS server handles tens of thousands of devices. But this number isn’t the point.
The point is not having to re-architect when you outgrow the first design.
NetXMS distributes through proxies and zones. Remote sites poll locally, buffer data when the link to the central server drops, and forward it when the link returns.
Overlapping address spaces across sites are handled by zoning rather than by renumbering someone’s network. A monitoring estate that started as one server in one data centre extends to forty branches without becoming a different product.
The same flexibility applies to fitting into an existing stack. Templates, NXSL scripting, a REST API and modular extensions mean the platform bends around what you already run — Grafana, ntopng (added from NetXMS 7), a ticketing system, a custom CMDB — rather than demanding that everything else move.
Discovery and maps you don’t draw by hand (unless you want to)
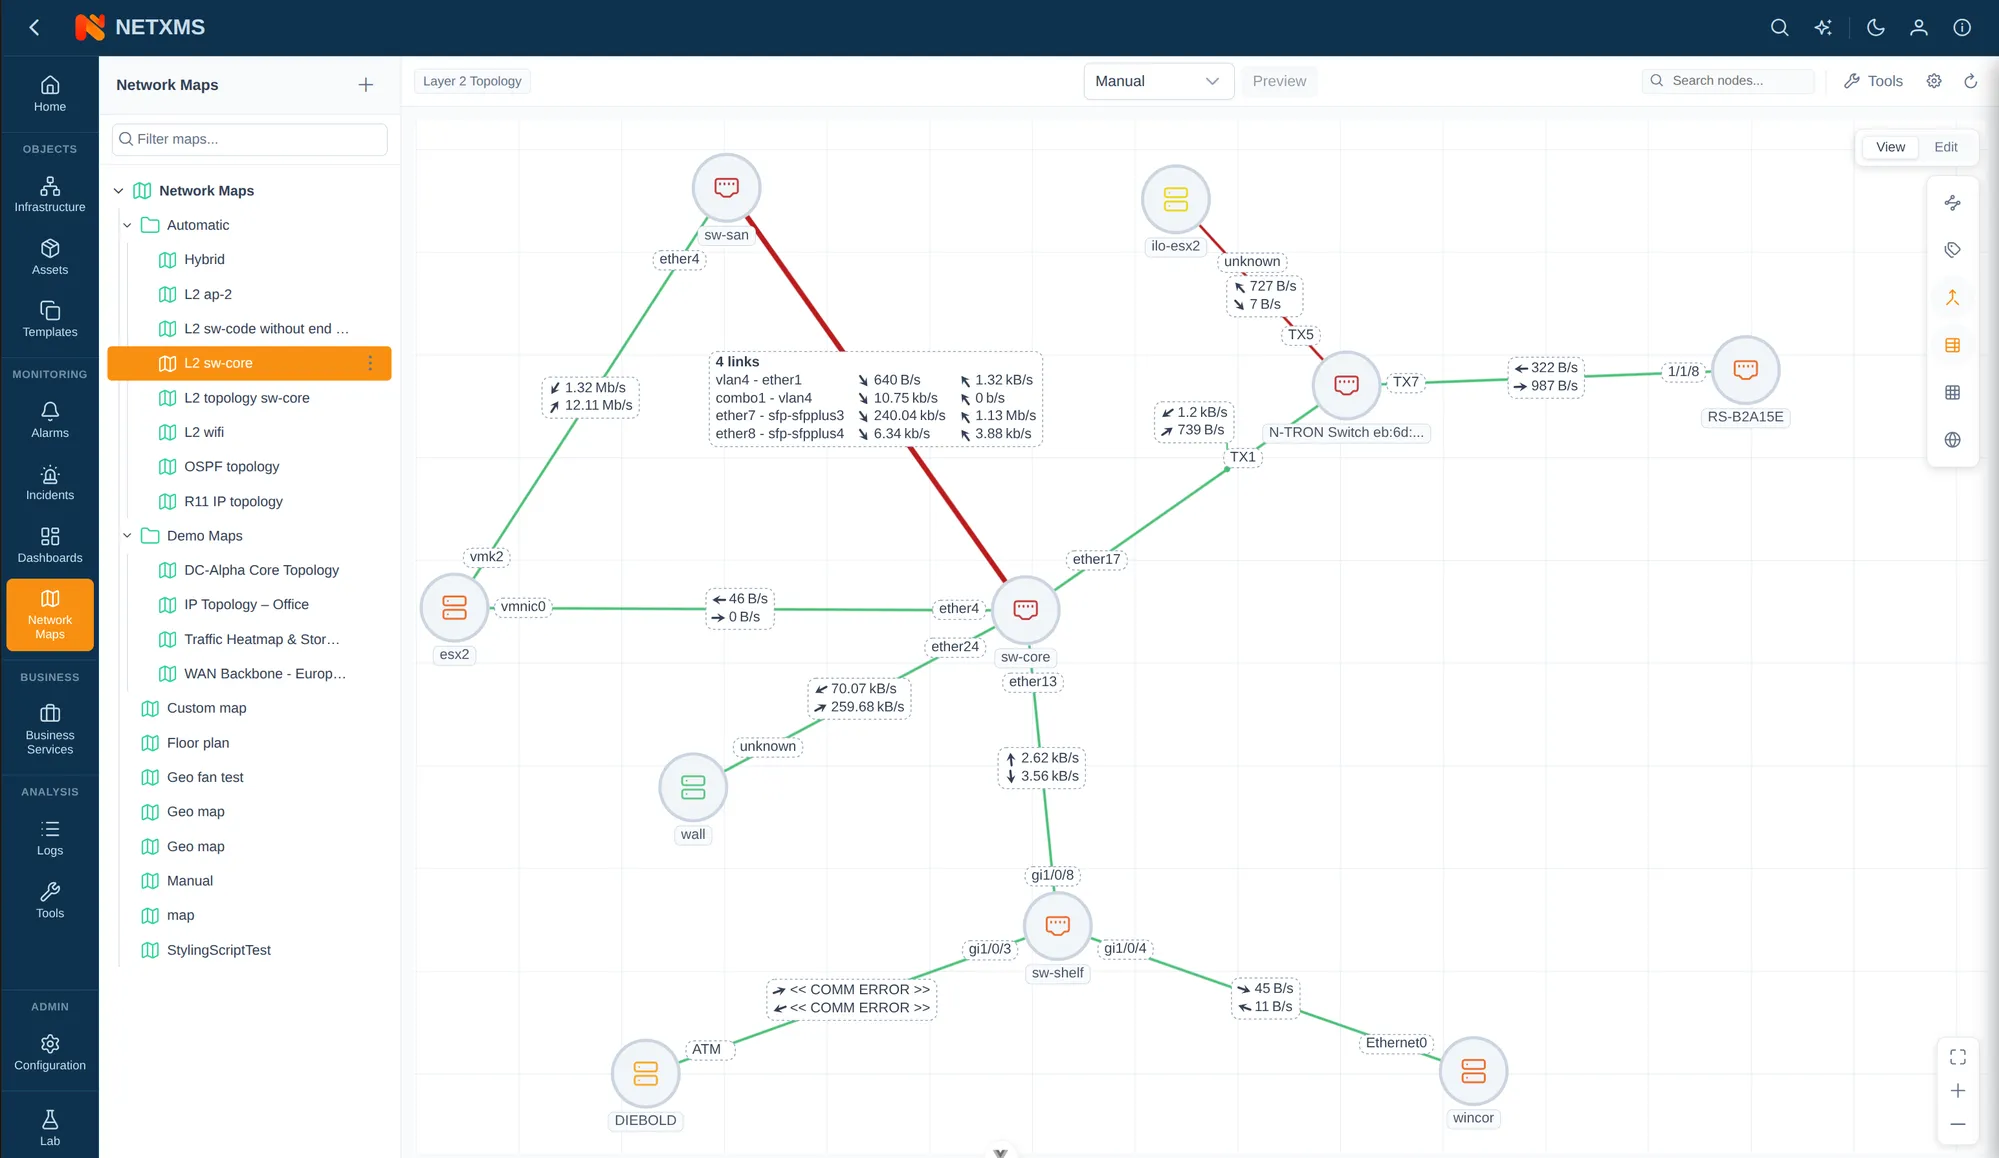
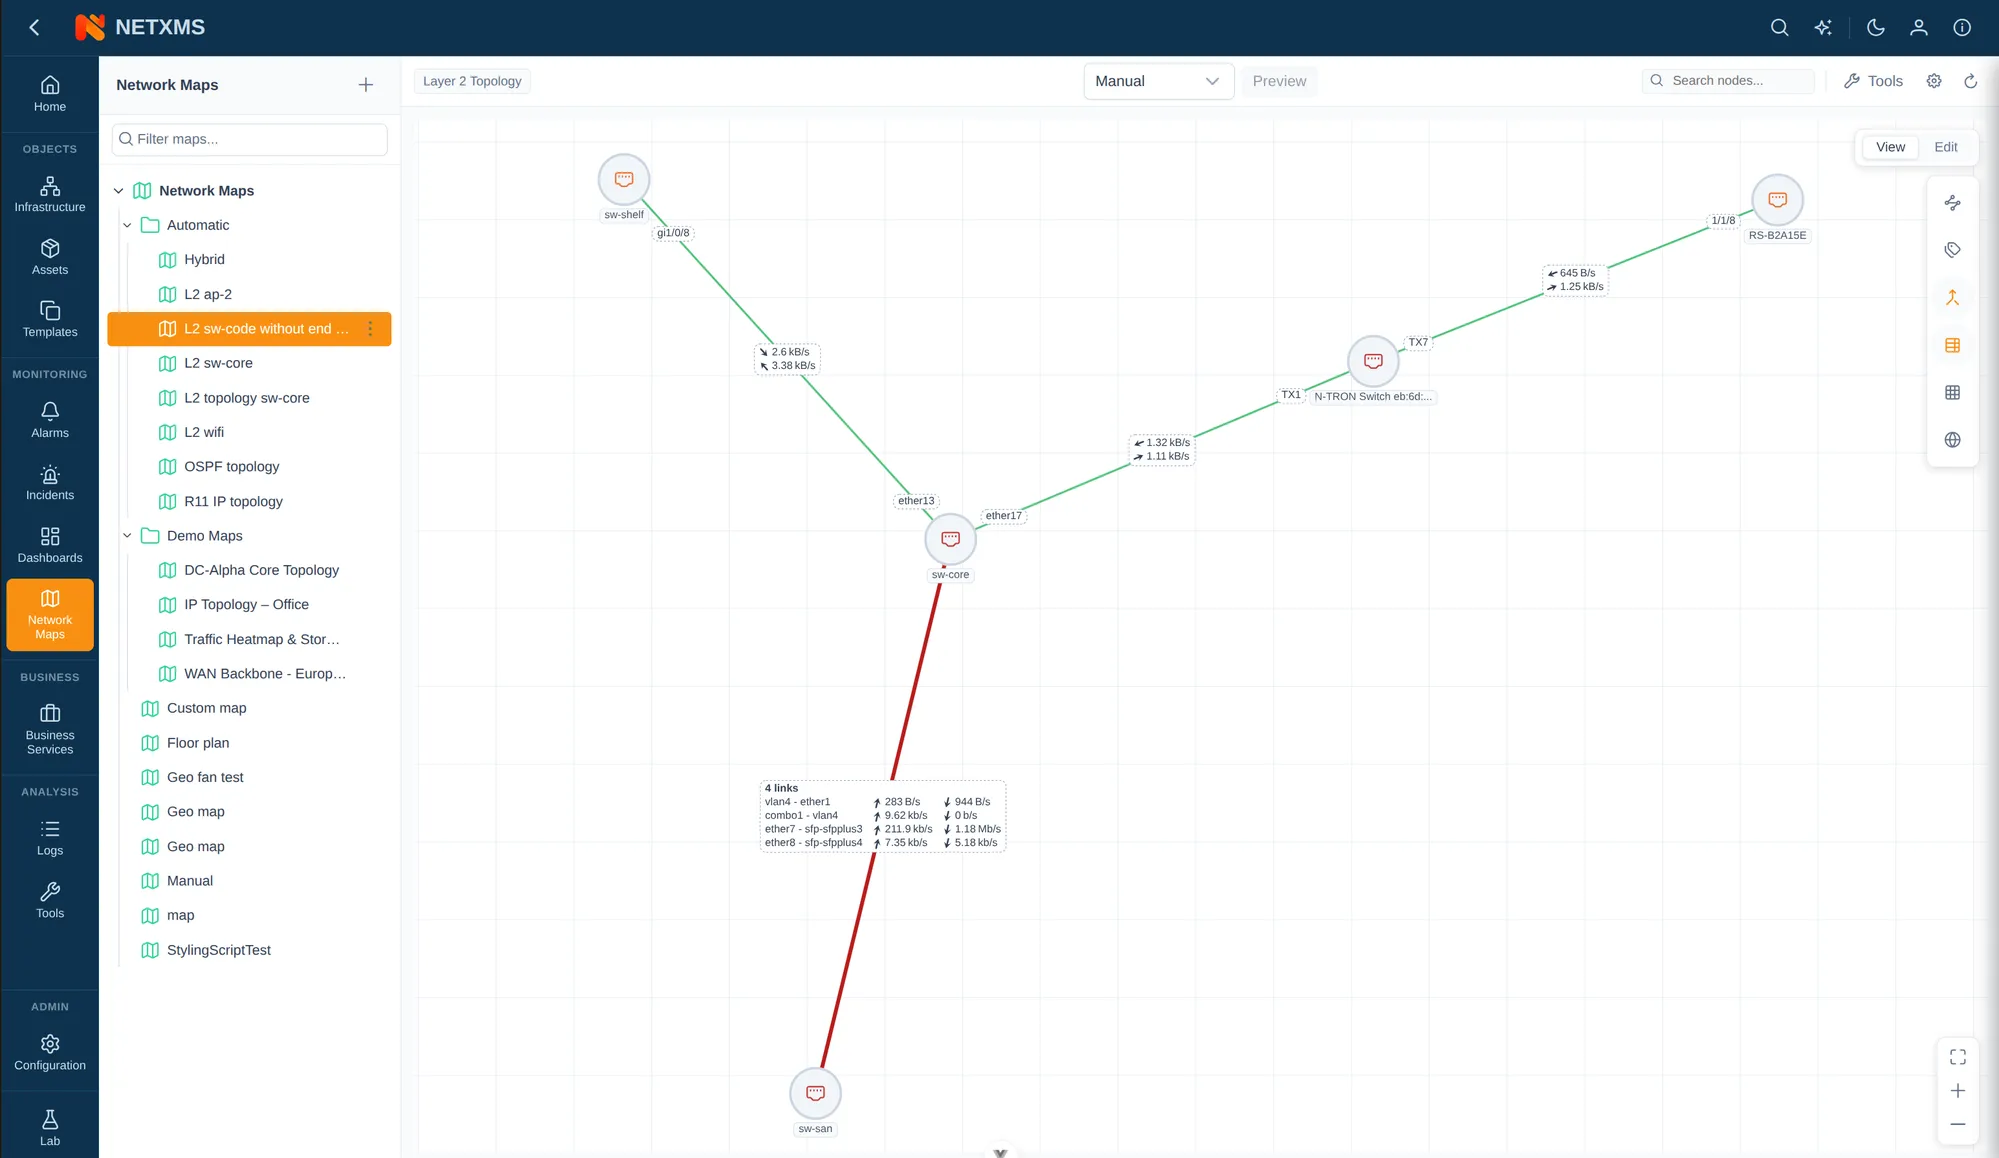
Automatic topology discovery is table stakes on paper and surprisingly rare in practice. NetXMS builds Layer 2 topology from LLDP and CDP neighbours, switch forwarding databases and ARP caches, and Layer 3 views from routing tables, with OSPF-aware and IP-layer maps alongside.
The interesting problem isn’t generating a map, though. It’s what happens when the map is generated.
Run automatic discovery across a few hundred switches and you get a single accurate diagram that no human can read. It’s often a dense blob where every device is technically present and nothing is findable. Most teams look at it once and go back to Visio.
This is where scripting earns its place. Because NetXMS map contents can be filtered programmatically, you can produce one map per fibre ring, per site, or per device role, each showing only the switches that belong there and hiding the end-device sprawl. The topology stays automatic and current; the presentation stays legible.
Large fibre networks are where this shows up most sharply, and it’s consistently one of the first things operators tell us they kept using after the trial.
Where the data lives, and who gets to see it
For banks, defence, utilities and public sector, the first question about AI features is rarely what they do. It’s where the data goes.
NetXMS runs on-premises. No cloud dependency, no telemetry leaving the network as a condition of the product working.
That extends to the AI layer, which supports local models through Ollama alongside hosted providers, routed by named slots.
So a fast hosted model can serve interactive chat while sensitive analysis runs entirely on local hardware. The prompt-injection guard can be pointed at a local model too, keeping user message content off external APIs.
A function stop list lets administrators block specific capabilities from reaching any external provider at all, which matters most for things like device configuration backups that often contain credentials.
Organisations handling highly sensitive infrastructure data can run the entire AI subsystem locally. That option existing at all is often what makes the conversation possible.
The boring criterion that matters
Every open-source evaluation carries two quiet fears: that the project gets abandoned, and that it gets acquired and repriced.
NetXMS has been in active development since 2003. The two original authors still maintain it and still run the company behind it. So, when a case needs a fix, it goes to someone who can make a decision, not to a tier that escalates into a queue.
That’s an unglamorous thing to put in a comparison table. But it’s also the criterion that tends to decide procurement in regulated industries, where the platform you pick has to still be there in a decade.
What this adds up to
Nobody buys a monitoring platform for one feature. They buy the one that stopped producing “no, but you could script that” answers during evaluation.
The one that covered the network, the servers, the applications and the industrial equipment, priced predictably, shipped the new capabilities instead of promising them, and scaled without a redesign.
That’s the checklist we build against.
If you’re running an evaluation right now, we’re happy to be measured against your list rather than ours — book a demo or download NetXMS and try it now.