
The reasons for major challenges for such companies usually lie in the nature of their networks, which are
- huge, often with tens of thousands of devices in it
- distributed, sometimes with poor connectivity
- diverse, with multi-vendor equipment
- and often with connectiveness issues, with parts of the network not even directly accessible by the monitoring server.
Add to this overlapping address ranges and the requirement for customers to access the monitoring data, and you get a highly demanding standard. Luckily, it’s one that NetXMS can live up to, offering that needed flexibility and a tailored approach for multi-vendor infrastructures.
The main reasons why such companies choose NetXMS are
-
the proven track record in handling monitoring of huge networks with tens of thousands of devices with a single server
-
then, it’s the flexibility of NetXMS, which allows you to
- realise the craziest of configurations, using NetXMS proprietary agents and other proxies;
- then, properly process events, spotting complex correlations, and
- do a lot of stuff in the network and device management department
-
NetXMS is an all-in-one platform that can monitor different type of devices of multiple brands, using a single server — so, it’s great for hybrid networks that currently use multiple solutions
-
and, finally — our professional support and development teams delivering tailored solutions, which are often needed as every company is a unique universe.
Let’s see what else is under the hood of NetXMS, that is able to substitute multiple platforms in all-in-one solution, offering A to Z deployment and professional support.
CHALLENGE 1 — NETWORK AND SCALABILITY
As we said, NetXMS was designed for and tested on large networks. The biggest installation where NetXMS is used, as of now, is a network of an internet service provider with over 17 thousand devices in it — and growing.
For efficient deployment in such complex networks, NetXMS offers
- Automated device discovery
- Automated topology discovery
- Configuration packs for common scenarios
- Proxy functionality for handling local traffic in distributed deployments
As soon as NetXMS is deployed and configured, adding new devices and scaling in general will happen automatically.
The monitoring server itself runs on Windows, AIX and Linux and can be easily integrated with the company’s existing systems, which is often essential. Besides SNMP, NetXMS supports a wide range of protocols and all the most popular database engines.
All this is a full-featured infrastructure for making sure you gather and keep data from all your devices. Now you need to organise this data and make it work for you.
CHALLENGE 2 — ORGANISATION, ACCESS, ZONES
This is the NetXMS system’s view. On the left you have your entire network grouped the way you want it — geographically, by type or applying any other logic.
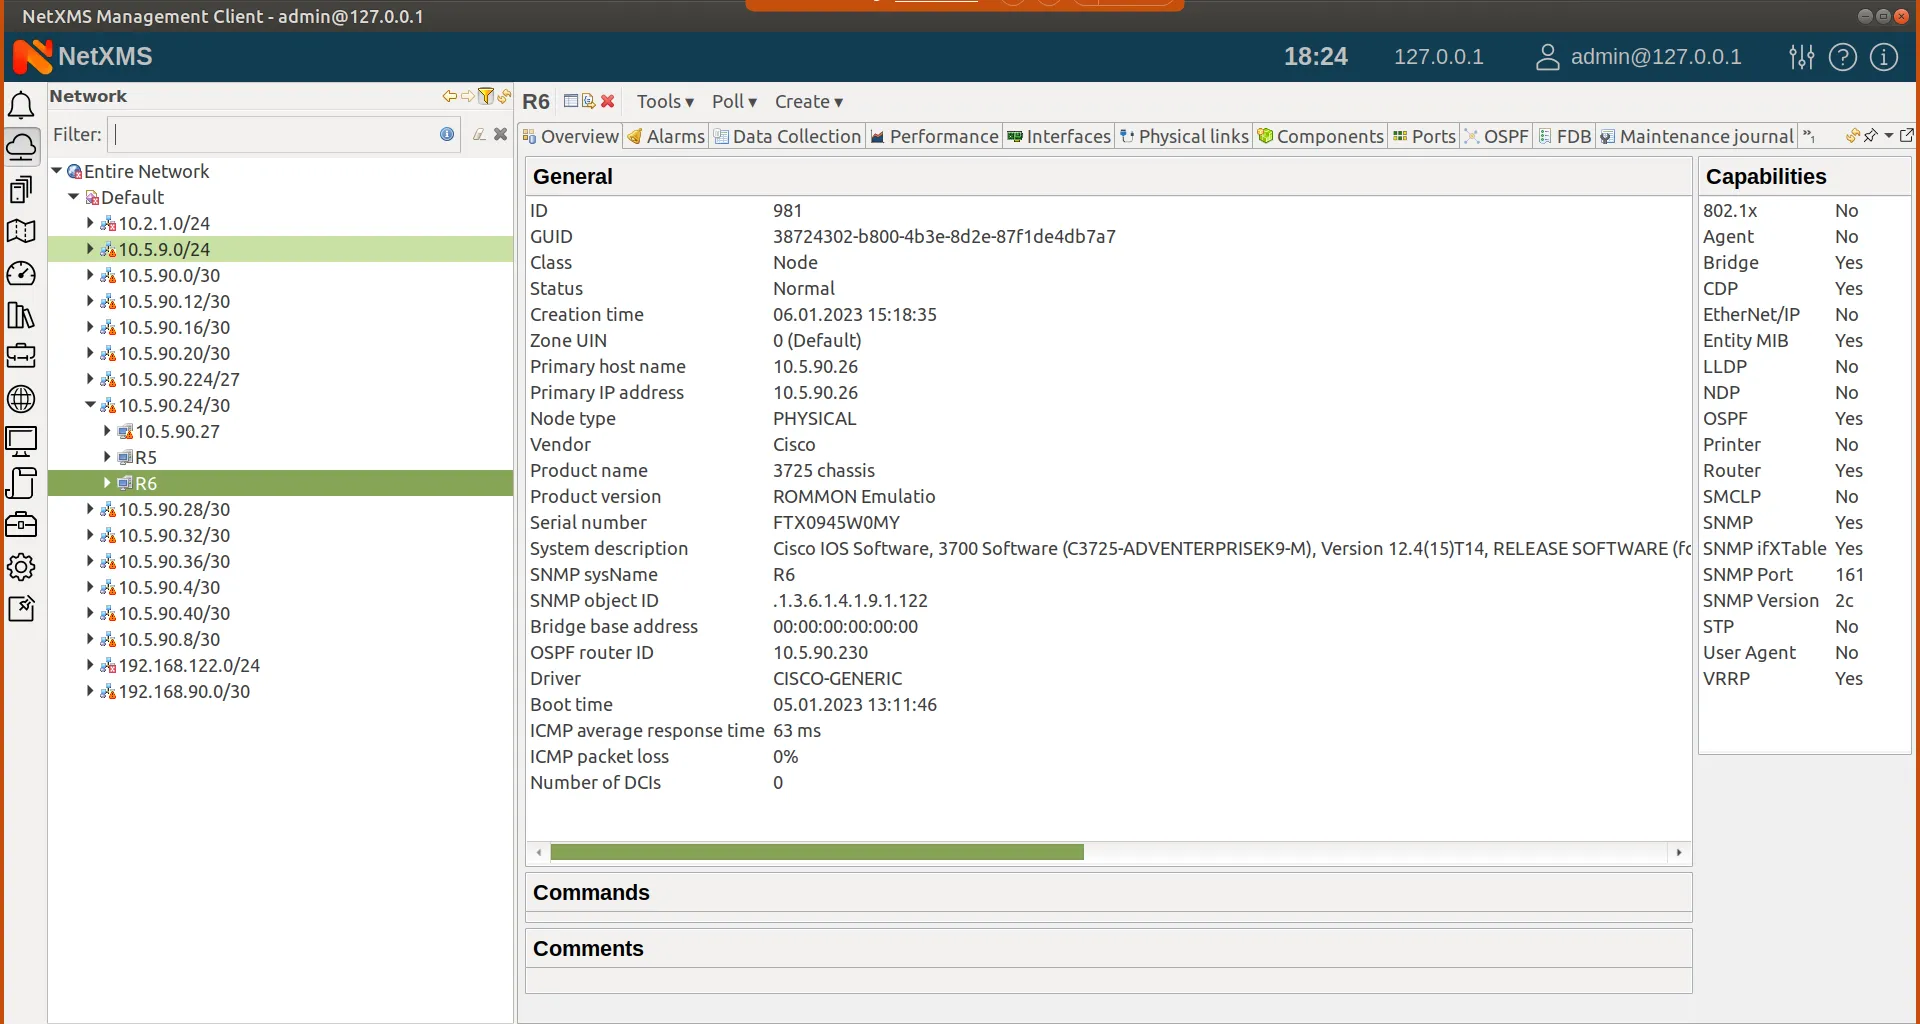
One and the same device can be in different groups, which is important when you’d like to assign different type of access rights to different team members. For example, an operator can just see alarms and reboot the servers, while only technical Team Lead can manage files and do upgrades.
NetXMS collects all essential information about equipment, such as vendor and model, as well as performance data about each unit. Thus, you will always have robust benchmark data at hand for further work, allowing you to suggest the most effective interventions.
For NetXMS it doesn’t matter what type of devices there are, so long as they use the data protocols that the monitoring system understands. Or they have the NetXMS agent installed on them, ensuring data sending from the device to the monitoring server.
The NetXMS proprietary agent also offers proxy functionality. NetXMS allows the monitored networks to be divided into independent zones. All communication with devices within a zone is then executed through the proxy.
More than one proxy can be used for each zone for load balancing in case of communication failure with one of the proxies. This makes NetXMS exceptionally flexible and stable in its performance.
Also, in the case of connectivity interruption, the proxy agent stores the collected data locally, to be later resynchronized with the central server as soon as the connection is restored.
Each of the zones may have overlapping IP addresses, yet the monitoring server will still be able to build a correct topology with complete information on each zone.
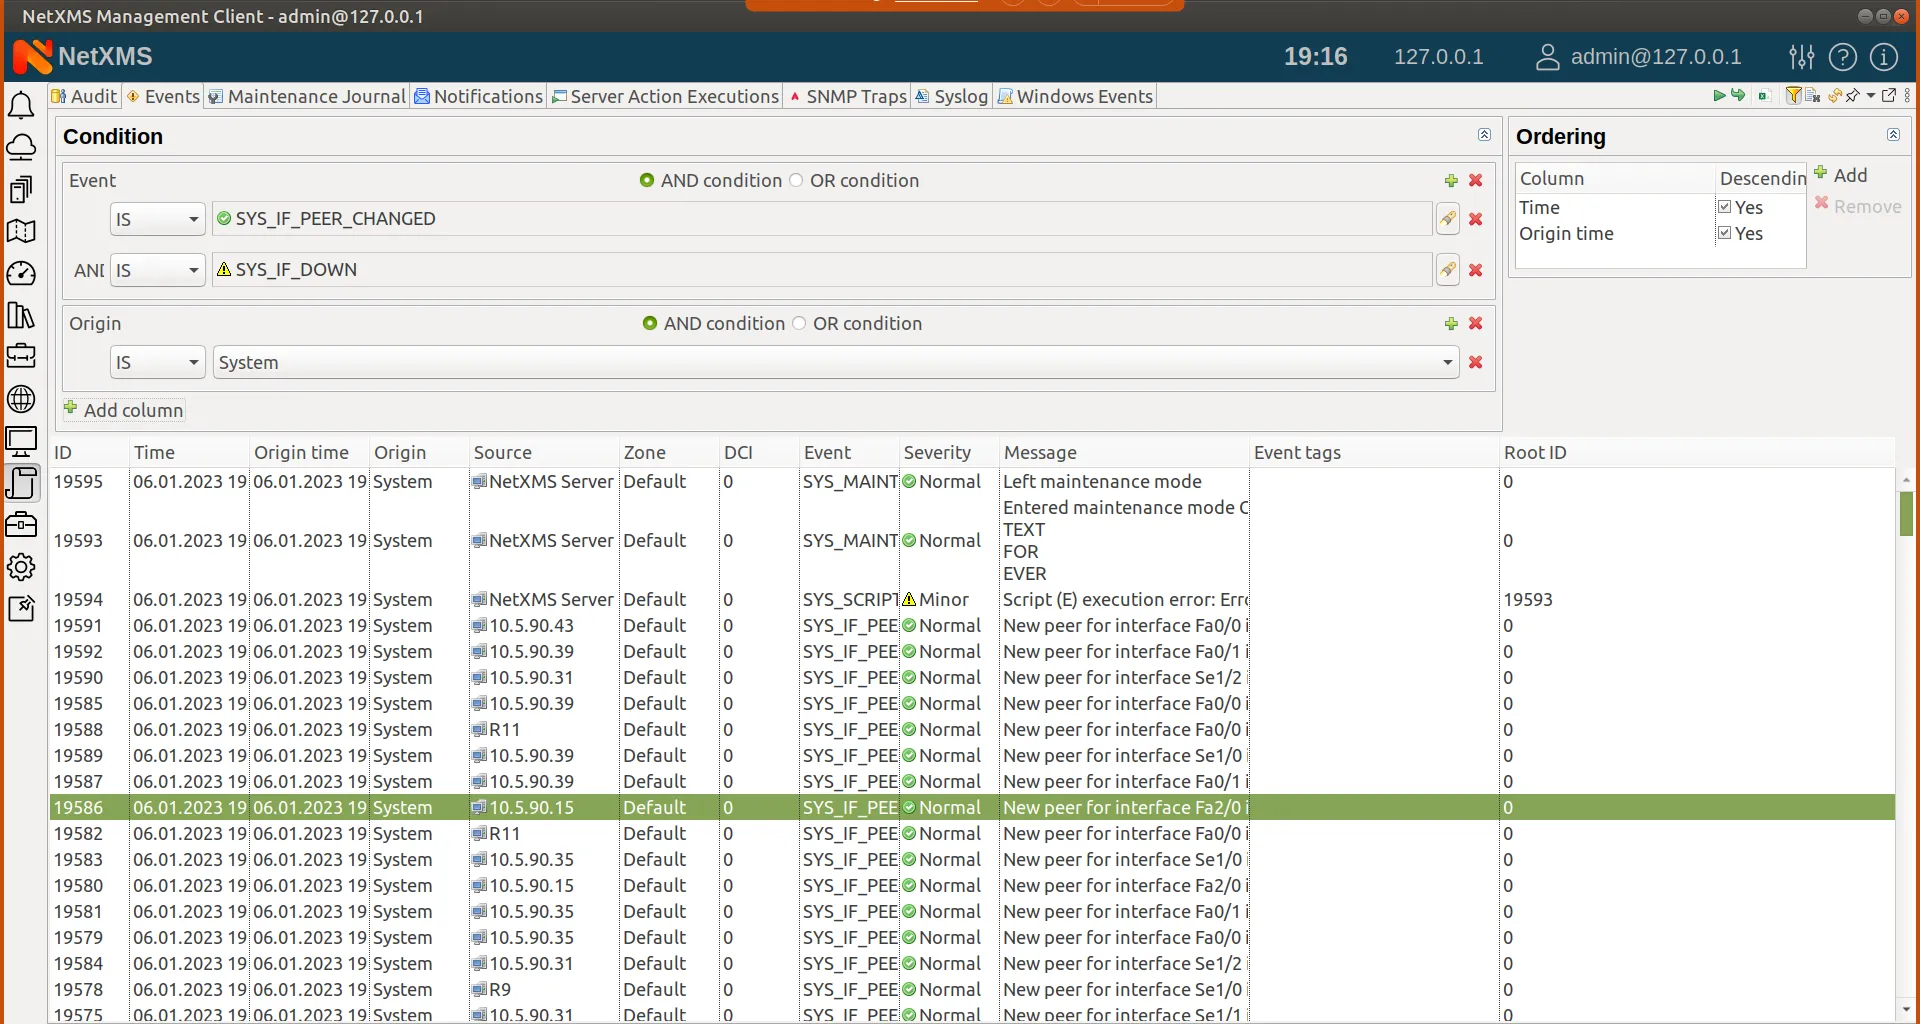
CHALLENGE 3 — EVENTS, COMMANDS, AND COMPLEX CORRELATIONS
NetXMS flexibility is also manifesting in how you can configure your incidents — define thresholds and assign automatic actions. We like to say that NetXMS is like a monitoring canvas, which allows you to configure monitoring of your infrastructure the way you want it.
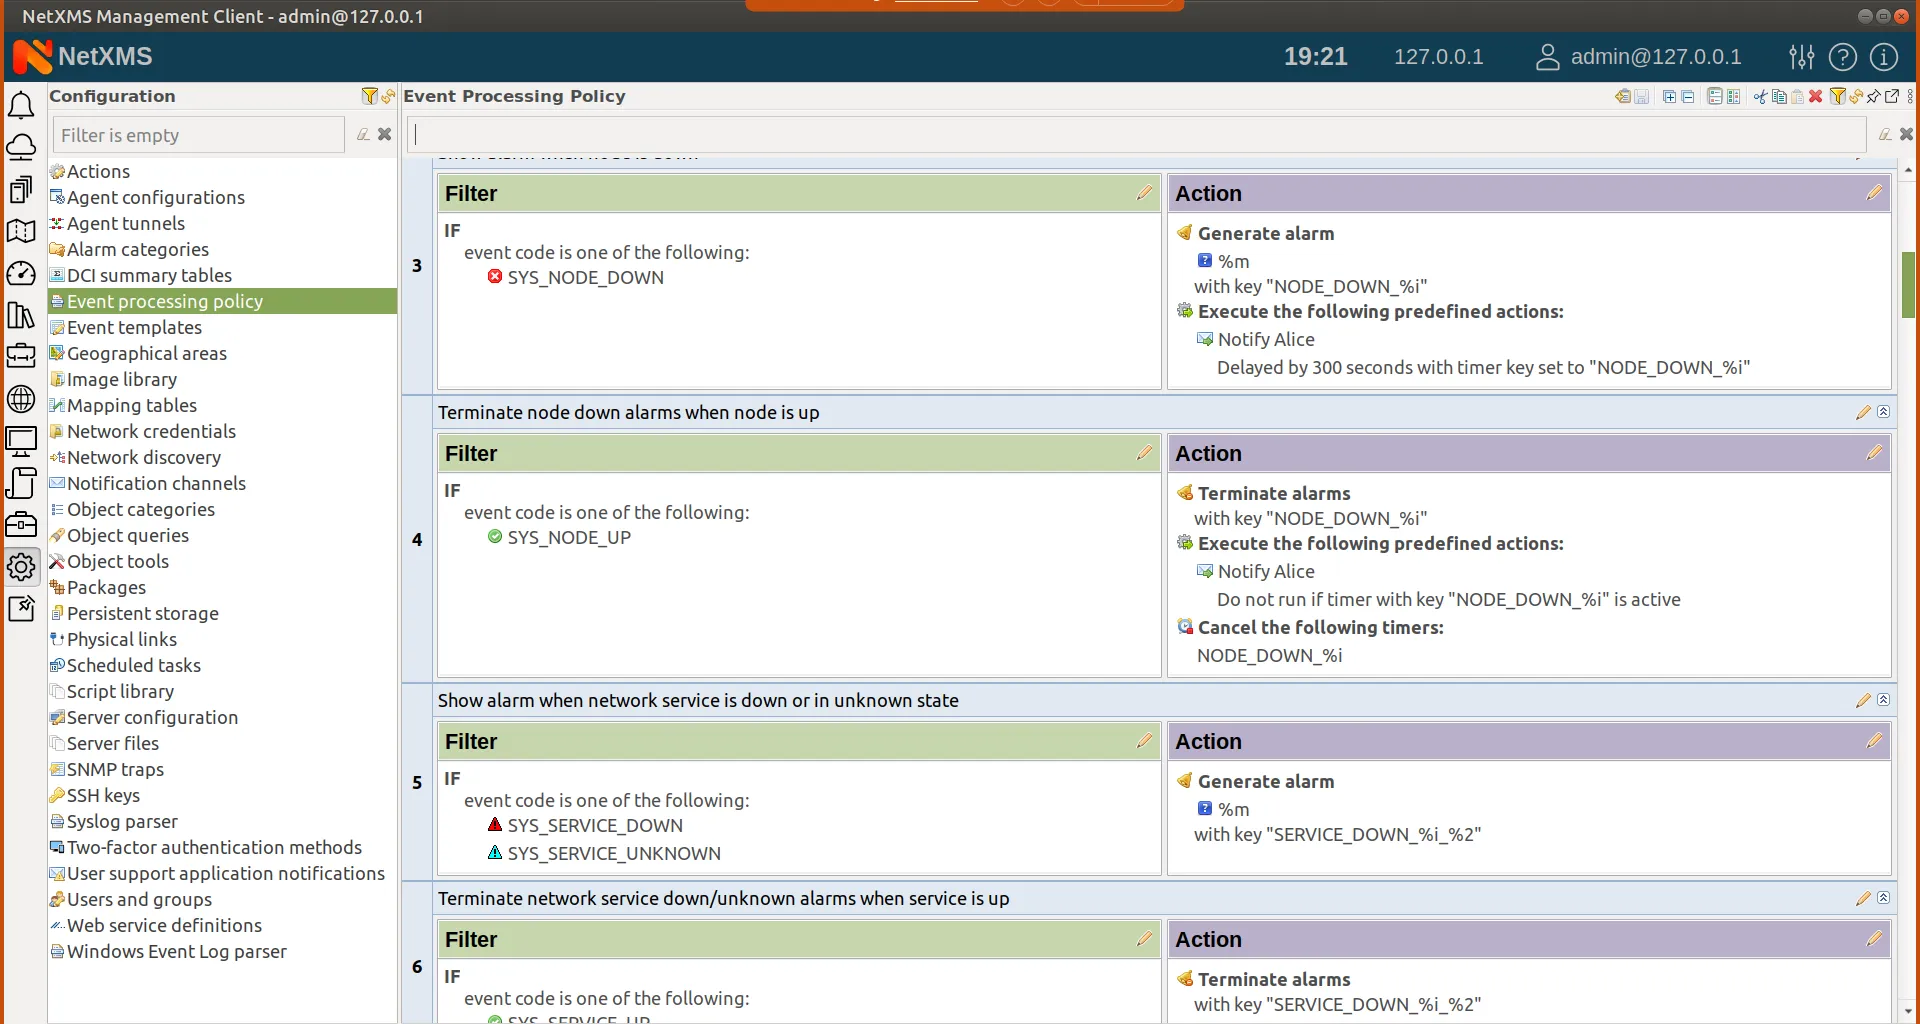
Our enterprise clients especially appreciate it, as they know their network best. With NetXMS you can define what events matter and what don’t, and you can set up different types of event correlations that in the context of your specific network make sense.
Many companies will have their own ticketing systems and NetXMS, having full API, can easily integrate with them. But if not, then NetXMS can offer you incident management features that you can use.
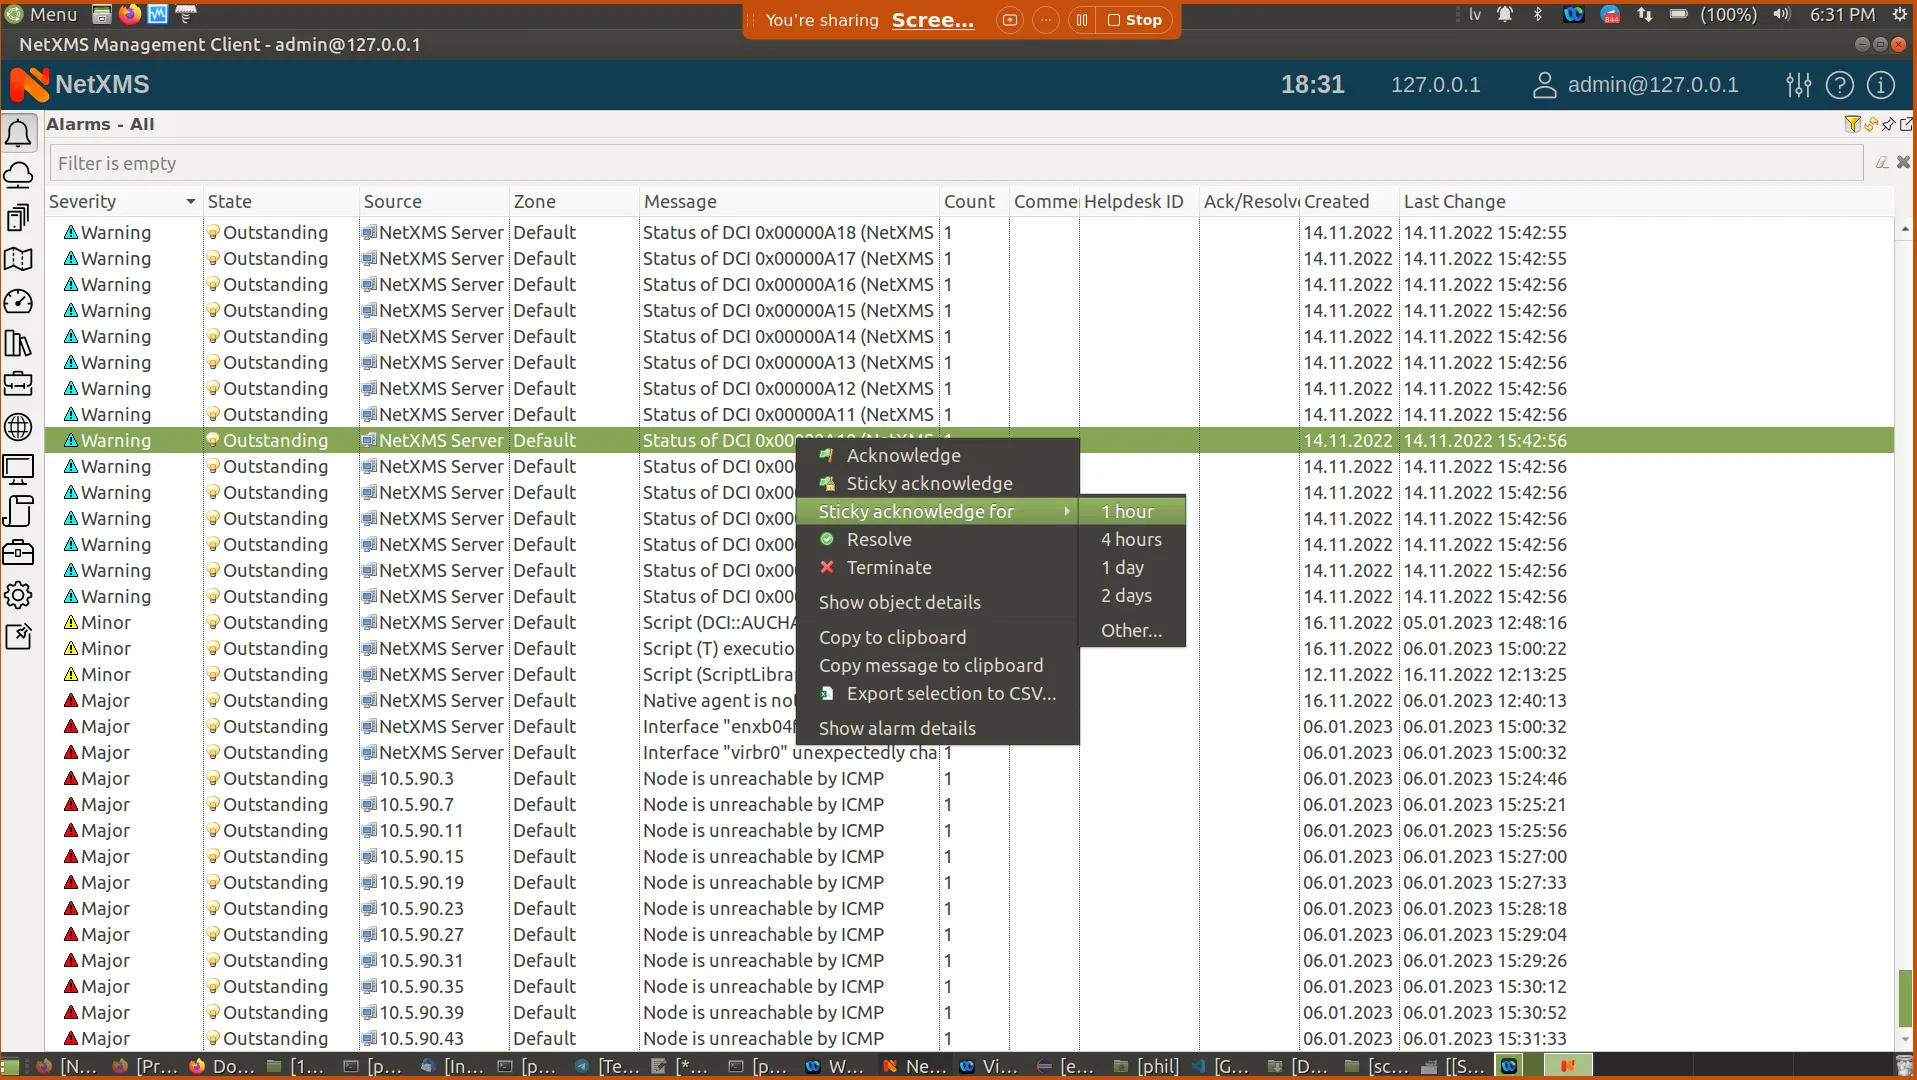
- Mark your alarm as acknowledged
- or resolved
- you can also automatically escalate the incident to another team member. For example, if the temperature of a monitored server is out of the allowed range for longer than 20 minutes, the respective manager will get informed about it.
CHALLENGE 4 — BIGGER PICTURE
Of course, all the functionality above is not only needed to manage your network but also for you to see the bigger picture. This is where Dashboards, Reports and Business services come in.
There are indeed very wide possibilities here — from real-time lists and graphs to various reports and assigning a business-logic to the scopes of data deeming your service to be working or not in general.
Dashboards can be custom created, adding any type of graph or indicator. You can create any number of dashboards — for your system administrator, IT director, CEO, you name it. There are also context dashboards’ feature that allow you to show preconfigured set of dashboard elements with data taken from currently selected device.
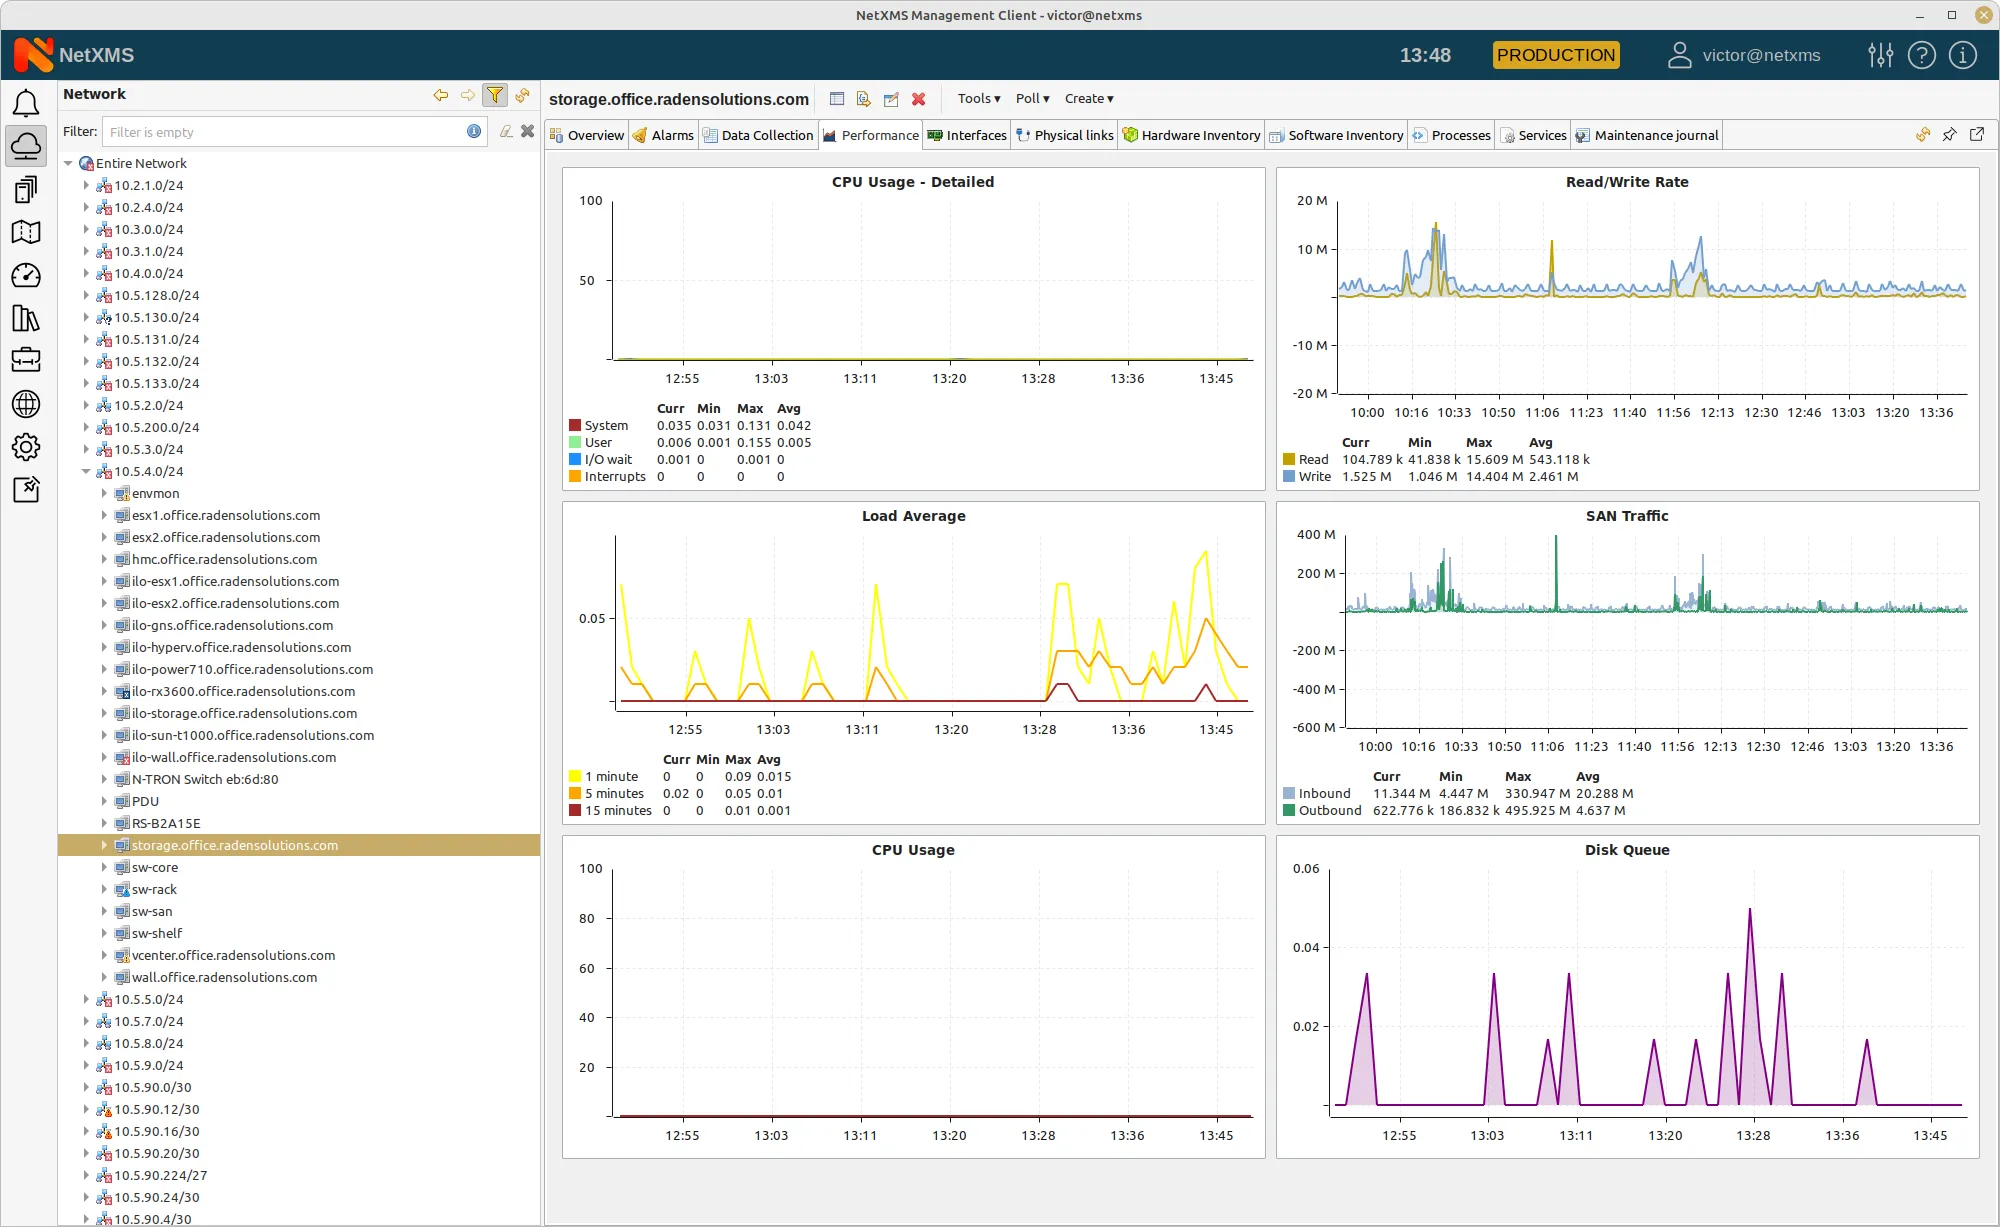
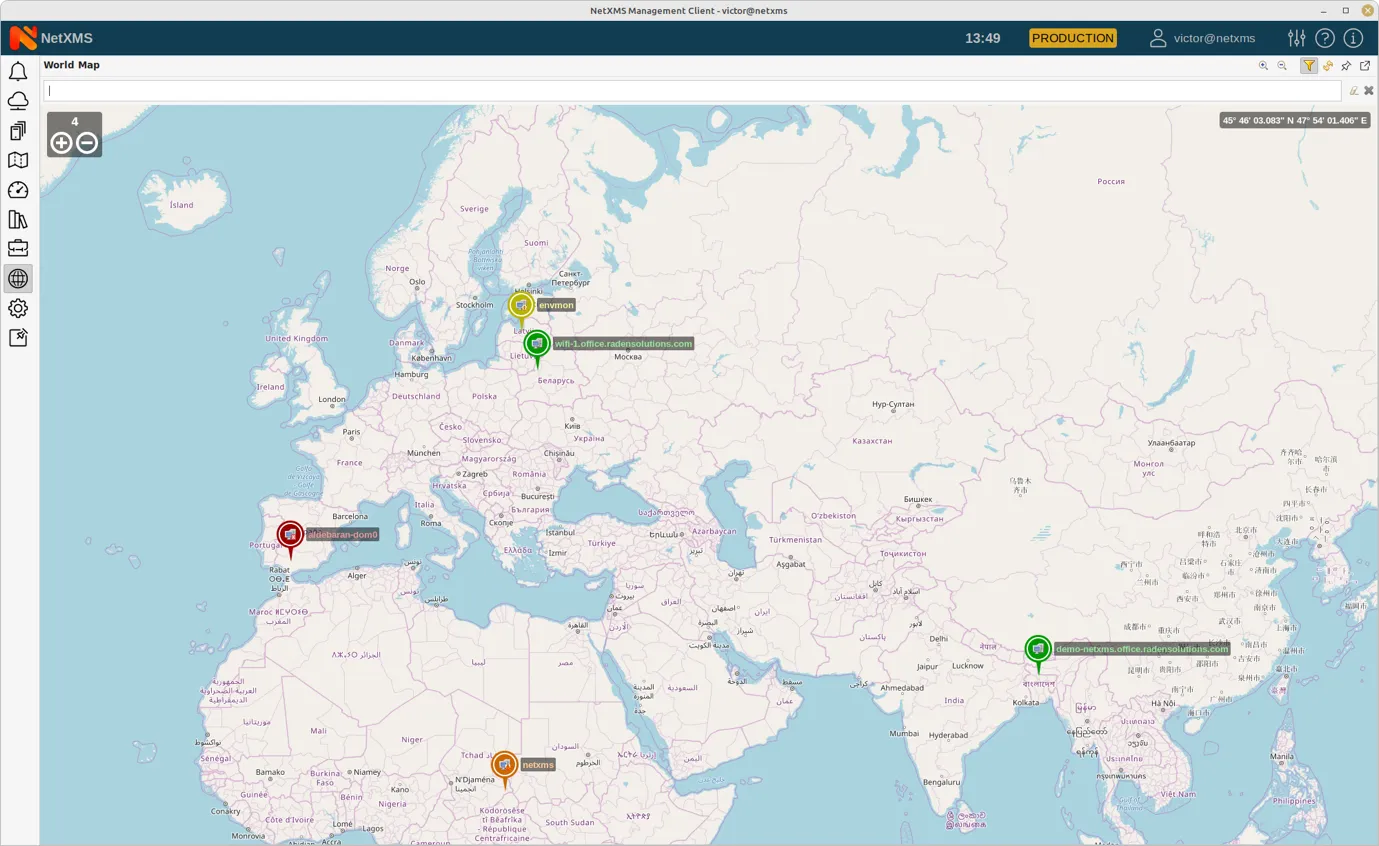
There are over thirty dashboard elements, including, geographic and network maps, different types of monitors (files, events, etc.), data tables, and status maps (for example, you can add a status map to your dashboard, where you will quickly see the colour-coded status of your devices).
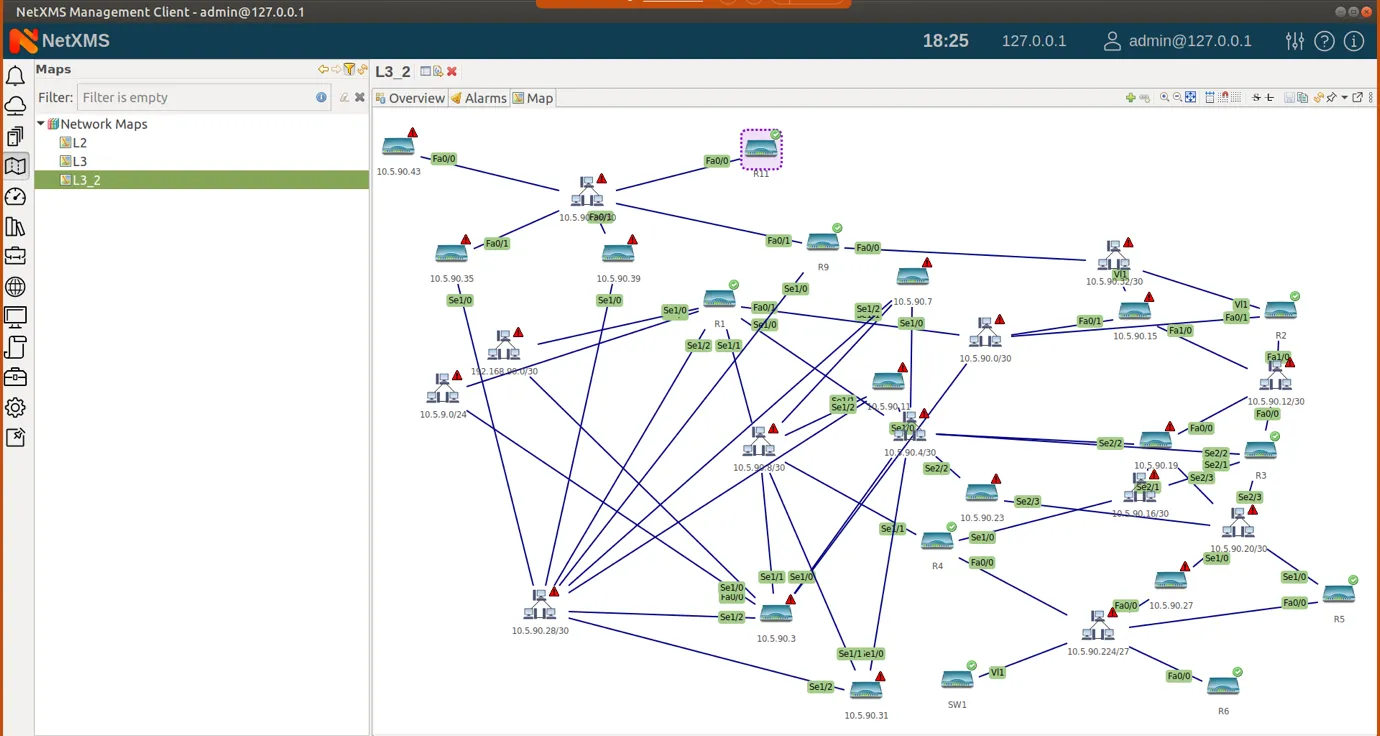
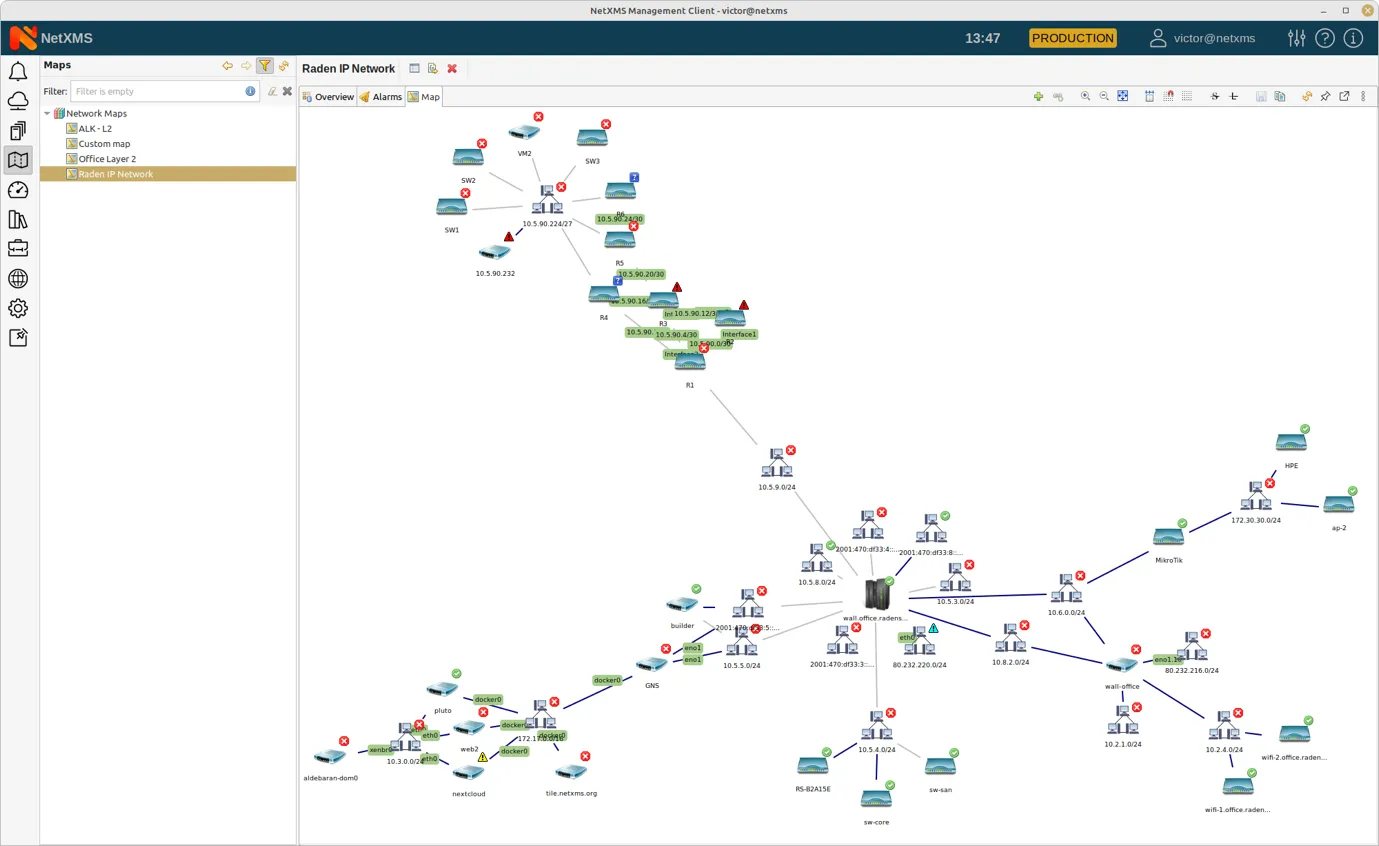
Of course, you can also visualize topology information about your network, creating geographical maps and schematic network maps. As NetXMS has an automatic network topology discovery function that we already mentioned, so it will build this map automatically.
You can also create any type of reports that you need for your decision-making:
- availability reports
- malfunction reports
- different type of statistic about processes that might interest you in particular
You can create any type of custom reports yourself — or we can help and do it for you.
All these features make NetXMS literally the software of choice for big enterprises, Telecoms, and MSPs. With NetXMS they can organise their distributed networks and diverse environments for efficient monitoring, as well as use the huge pool of data for both — going into details, establishing correlations, and also having a bigger picture of the infrastructure health.
Have questions? Please, reach out to us with any comments to [email protected]