First things first, could you, please tell us a few words about yourself, what you do for work?
I am the Head of the IT department in an enterprise. There, under my care, I have a data centre, 400 pieces of network equipment (mostly switches, and routers), 50 servers, and a multitude of applications. I monitor a bunch of proprietary services, written for the different types of equipment. They often are not too advanced, and we tend to encounter a lot of problems and obstacles to a trouble-free working process. And I monitor them, write my own watchdogs, etc.
I am also a certified network administrator, as well as a certified trainer of a world-known network equipment brand, with hundreds of students.
But that as well is not all!
In addition, I also support two small internet service providers as a consultant, both remotely, in other countries.
So, my activity is very tightly connected with IT, enterprise, and everything that relates to it. I started in the IT field about a decade ago. And when I came to work for the company I’m currently working in, everything there was in decline. All the services had to be rebuilt from scratch, and the question of how to monitor them obviously came up. Vigorous network and device monitoring was completely normal in the market at that time. But it was not normal for the environment I was in.
How did you first come across NetXMS? What were you looking for at that moment?
The first monitoring system I used was also an open-source system, much more popular than NetXMS — a go-to monitoring system for many sysadmins. At that point, my main disappointment with that system was data visualization. In addition, it was so difficult for me to read their documentation and understand anything in it at all.
There were complex scripts, complex integrations, complex templates, everything was complex. I couldn’t run many things out of the box at that time, and there was no flexibility in the UI either — you couldn’t just right-click on a device and perform actions.
So I went on exploring the market further. I looked into all the most popular open-source systems, including those of the network hardware vendors, but nothing could really satisfy me completely. Many systems were raw, and I encountered many problems using those.
This is when I stumbled upon the tutorials of Tomas Kirnak. He only talked about the core functionality and what was available out-of-the-box. And he spoke about NetXMS in such simple terms, explaining the system’s main concept, saying you really can configure the system in so many ways and aspects, that it can perfectly suit the infrastructure that you need to monitor. And it was 100% my case and what I needed. And when I put NetXMS to the test for myself, I was really surprised.
These main things persuaded me to go for the NetXMS monitoring system:
- There was a client application — that is, I could get an application to work on my Windows machine, which provided me with a lot of powerful flexibility in the UI itself. There I could have all the nodes lined up very conveniently. I could choose any view in this application, choose any blocks, any menus, and submenus — I displayed everything the way I wanted.
- I cannot mention it enough — the flexibility of the UI itself was extremely valuable for me. I wrote myself a couple of simple modules, and in just more or less two clicks I could connect to any hardware I was monitoring.
- There was a mobile app.
- I was pleased by the fact that most of my hardware types were already in the system.
- The launch chapters in the product documentation were written very clearly.
- It was powerful, pretty and handy — it was like a wrapped Christmas present I was looking for!
So, what was your experience using NetXMS?
I opened NetXMS, I installed it and got it up and running in a matter of minutes, because specifically in the manual those chapters that dealt with installation are described in the easiest possible way. And if you do everything right, within 7 minutes with the operating system ready, NetXMS is up and running.
It felt like an out-of-the-box start. You don’t need anything there — write 5 lines, and everything works. And that was fundamental. The ability to manage, the ability to perform functions with a right click — all played a major part in my choice.
Then I saw that there is an integration with Grafana — you can use really cool web dashboards that are already there. Run it, put it together, and get super-beautiful graphs, which NetXMS doesn’t have (and why should it? After all, there is a beautiful open-source product that you can use). Again, there were clear instructions on this topic.
After a year of using NetXMS, I went deeper into the system and started having questions. I went to the chat room, I left my question there, and it was answered immediately. Then, with permission, I wrote to one of the engineers in a private message, and he answered me in a couple of minutes — wow, the service was as responsive as they come. I wrote at 19:25, and at 19:26 I got an answer. It wasn’t even during business hours, and it was the 18th of December. And since then, I have realized that there is no point in looking further.
Many other monitoring systems came to my attention after I started using NetXMS in 2017. I sometimes check them out of curiosity. They may have the features that NetXMS doesn’t have, but nevertheless, these are usually little things that make it not worth switching to a new monitoring system that I don’t have confidence in.
Are your needs covered with NetXMS? What NetXMS features do you use most?
In my line of work, challenges are only growing, so the systems I work with have to grow with it. NetXMS has loads of functionality, I am not sure I am using all of it even now.
-
NetXMS desktop client application has an embedded browser, which for me is an excellent feature. There are a bunch of services that want to use Internet Explorer. So, to open such apps through NetXMS is just a pleasure. You don’t have to go into Microsoft Edge. You don’t need to make sure it’s reverse compatible with Internet Explorer, you don’t need to tweak it, make sure the system “remembers” my choices, and so on. It’s executed as simply as possible. You can just right-click tools / connect / http, and it opens it right in Internet Explorer.
But I would really like this browser to open from the server side. Why? So that the server, in fact, would be a proxy. Now it is a TCP tunnel function in NetXMS, and you have to do a little bit of wizardry there. It’s an agent feature, but the agent has to be on the server itself.
-
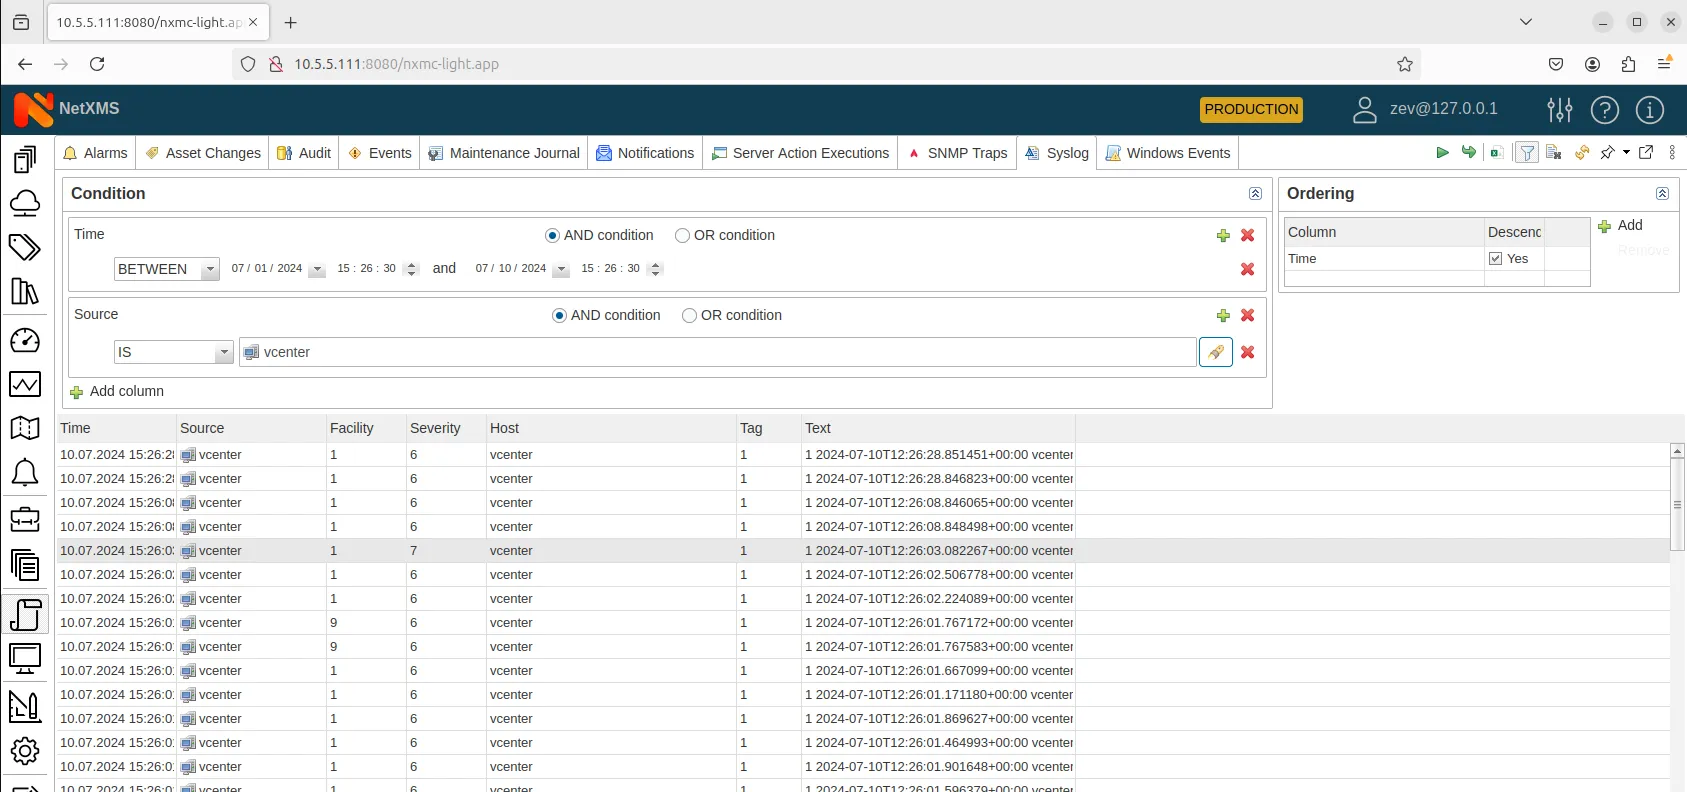
I was madly pleased that NetXMS has a built-in Syslog server — and right away with defined severities and marked with colours. I simply got all my equipment on Syslog, and I started noticing a bunch of alarms straight away. And thanks to the built-in filters and built-in mechanisms, I’ve got logs going. Normally everything is in green, and if something red goes through, you see it immediately and you know you need to pay attention to it.
And if let’s say, authentication failed when one of my users forgot to sign FireWatch or something like that. I can see it all from the console itself. It’s super cool.

Syslog log view in NetXMS -
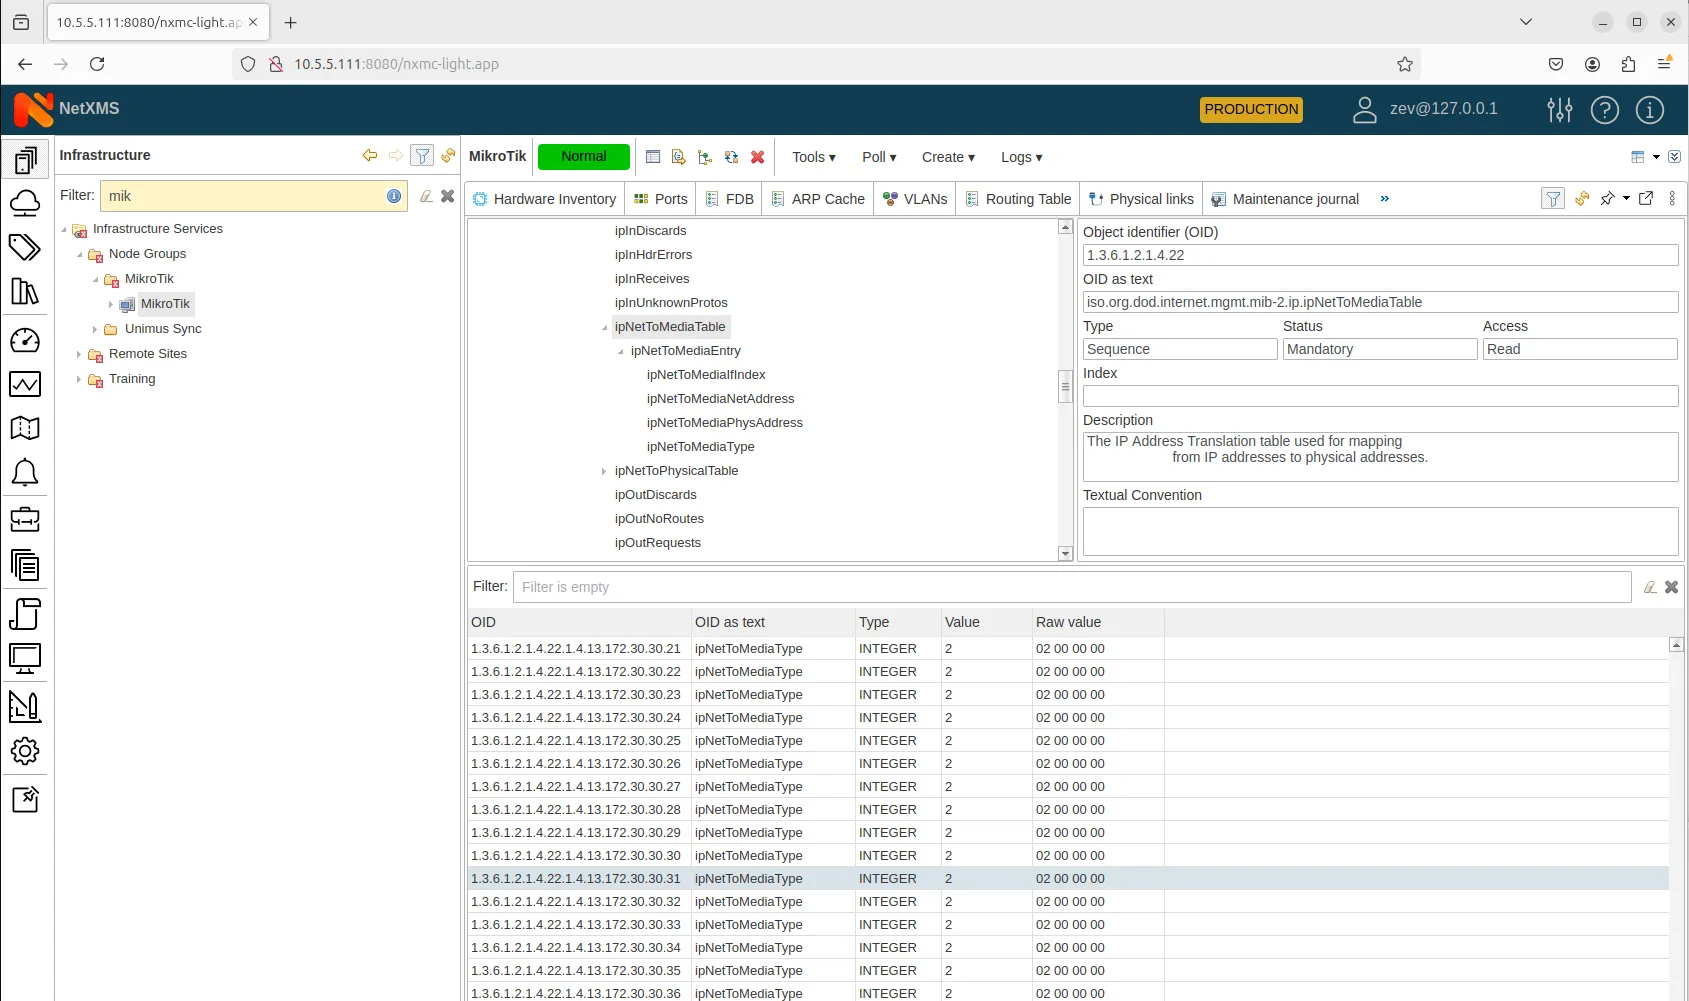
Wireless bridges — when you have a wireless bridge (the same Miktorik, for example), it has SNMP MIB that allows you to read the signal strength, the signal attenuation level, also the number of lost data packets in percentages. And all this data can be put directly on the map with the signal strength, updating in real-time. For me, it’s a delight to have that in a system.

MIB Explorer for Miktorik device -
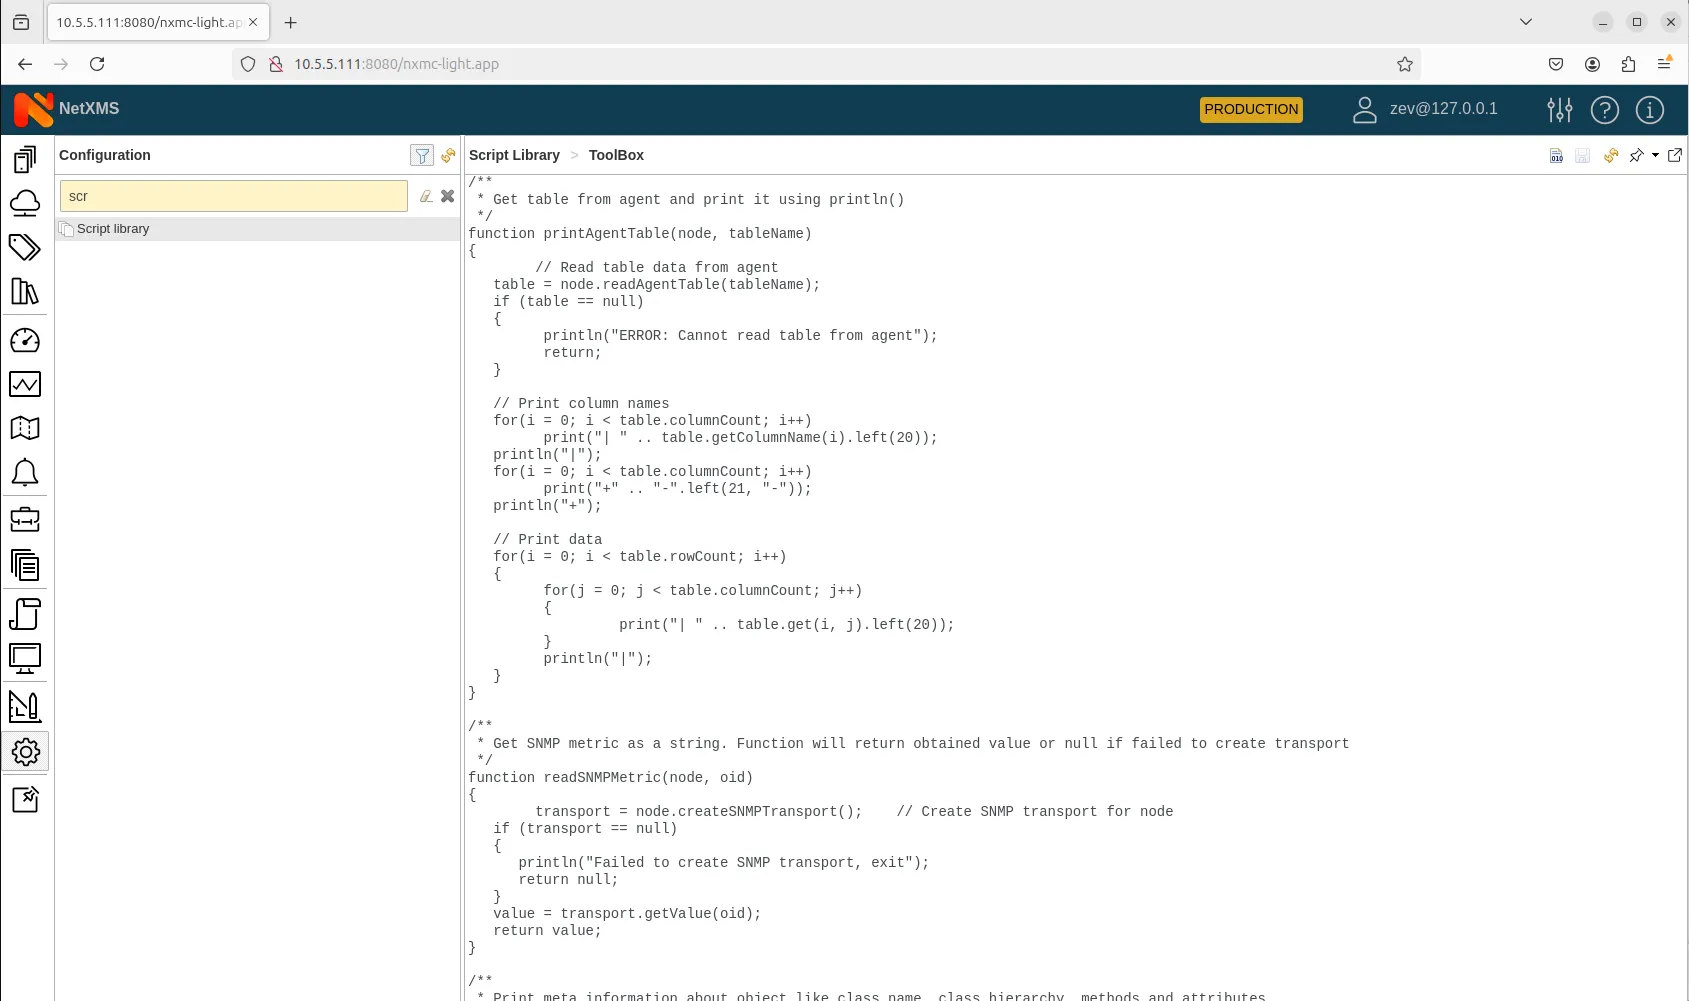
I used scripts to modify the collected data, it’s cool. I really like the fact that when I collect data, I can perform actions on it. And that there is a type of data collection like “string”.
That is, it doesn’t matter what manufacturer sends you, and what it writes in its database. You set up a string in your database, and just set equal/not equal thresholds. That’s fantastic.

“ToolBox” from the Script library in NetXMS -
I love that there is an agent and that the agent has a hardware inventory, and it also has a software inventory. That allows you to track whether something has been replaced from the equipment.
Unfortunately, in an enterprise environment, it happens quite often, that all of a sudden the RAM and hard drive are changed in a piece of equipment. What usually happens? A company buys a new computer, and in 2-3 months a person takes something out of it and appropriates it, putting something not so advanced instead. And NetXMS enables me to track all these things. This helps a lot.
-
And another cool feature that I use is that we can perform actions on the agent side. For example, I have a piece of equipment that can only be monitored on open ports. It’s very easy to run it from the agent. You ask the agent to monitor a TCP port here, and as a result, everything is in green again — this is what I like to see.
But if there is no answer, time-out — I see an alarm immediately. Great. And it is not limited, so you can do absolutely everything — you can collect logs, read text documents directly by agents, it’s so cool.
-
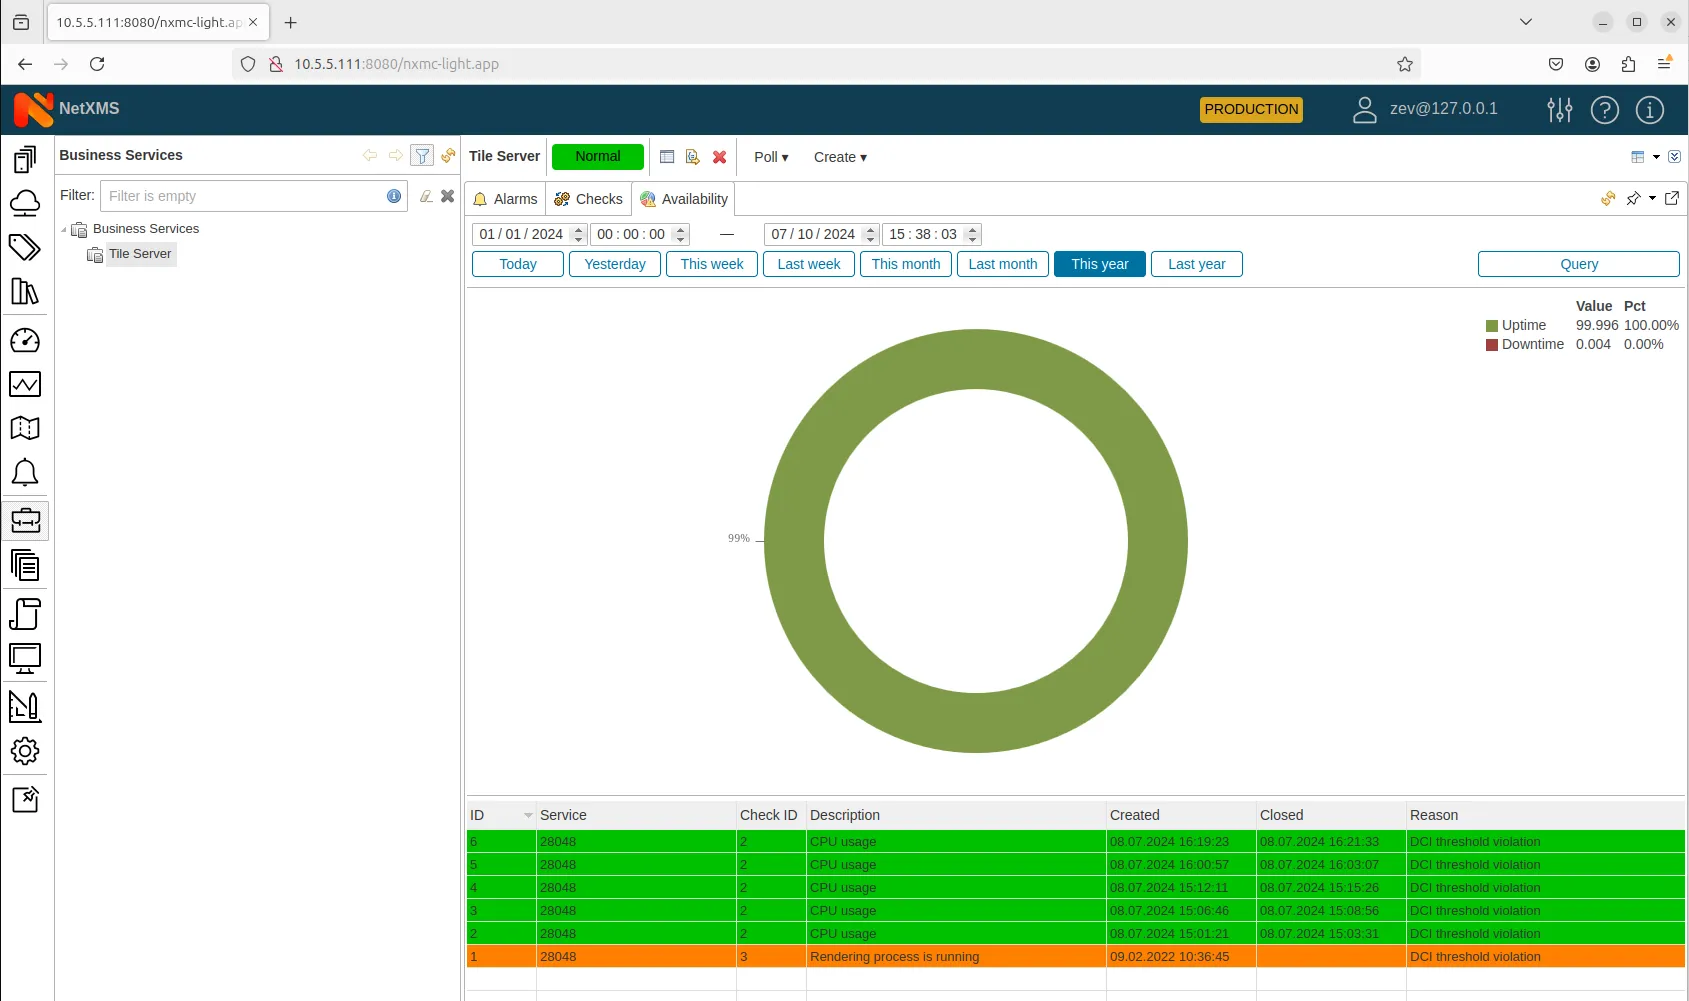
I recently discovered that NetXMS has a section called Business Services. So, I can collect certain key metrics and know in general how much time these metrics have been alert-free.
That’s so great — I would implement that for every sysadmin. I would go to a customer and say, look, when I took care of your IT infrastructure, you had a service running 99.999% of the time. Go to AWS and see how much those five nines cost. And don’t come to me again with a price question, please! This is really cool stuff. For people who use NetXMS monitoring for their customers, it’s making a lot of sense business-wise. This is something that will allow them to make money out of it.

Business Services perspective in NetXMS
Did it take long to learn how to use NetXMS? How steep was your learning curve?
For me it was rather smooth. One of my clients, a small ISP, never used a monitoring system before. I showed them only how to add devices in NetXMS, and how event processing policy works — that person then added 200 network devices in a week, drew a map, and it was quick and easy.
When I show NetXMS to people, I explain to them four things:
- how to register a device
- that each interface, each DCI is a separate entity, for which there is a log, and which can be used as a basis to further create alarms
- how to create metrics and bind the status of an object to one of the metrics
- how to use event policy
What’s sometimes missing is detailed how-to practices. There are obvious things for those who operate the system non-stop. However new user needs to learn what process in the system to use to achieve their goals. And this is where the confusion usually starts. The NetXMS manual is written in an engineering language, which is not a problem for me. But an ordinary user just doesn’t understand it that well. If there was a step-by-step how-to manual, it would be much easier.
For example, it’s hard to configure the event processing for the first time — it’s not very intuitive. The system itself, though, is super cool and allows me to solve 99% of all the tasks. For example, I have no sensors in the server room, but I am able to monitor the average temperature from all the hardware. This is great. With the event processing policy, I just ask the system to create an alarm when the temperature goes above 20 degrees. And it works.
If such features are just clearly explained step by step, that would be amazing.
What would be the additional functionality that would make NetXMS your ideal monitoring system?
All in all, I guess I’m rather an advanced user — I love the system, and I get tons of value from the support. I also do promote NetXMS whenever I can. But, of course, I do have many ideas on the new functionality in NetXMS. I’m quite sure the development roadmap for NetXMS is full, but one can dream!
More integrations, more functionality
I’d like to see one day an integration with Wazuh (from OSSEC). It’s a tool that collects, aggregates, indexes and analyzes security data, helping companies like ours detect intrusions, threats and behavioural anomalies.
Then, since this system is called NetXMS (i.e. it is deep into network monitoring), I dream that one day it will have an out-of-the-box integration with a great open-source utility called Oxidized app.
It collects backups from network equipment. So, for example, you ask it to check for backups every 5 minutes. And every 5 minutes it runs to the hardware, collects the backup, and checks if there’s a difference with a previous version. If there is no difference, it leaves the previous backup, and if there is, it takes the next version of the backup.
It would be amazing to have Proxmox monitoring module. Also, I would love to see better scaling maps in NetXMS.
As so many sysadmins, I work a lot with Mikrotik devices, so having a container for Mikrotik would be valuable.
Another great functionality for my line of work would be the monitoring of video cameras. But I guess, it’s a huge whole new direction there.
Thank you, Alex, for sharing your story! Hearing feedback from our users is golden. We invite everyone willing to share it to contact us at [email protected] for a user interview.

