This article explores the concept of table metrics, how they differ from single value metrics, their advantages, the sources, and a brief walkthrough of configuring them in NetXMS.
Understanding Table Metrics
NetXMS collects two types of metrics: single-value metrics and table metrics. Single-value metrics, as the name suggests, collect only one data value.
In contrast, table metrics can collect data in bulk, effectively encapsulating multiple values that can be collected simultaneously.
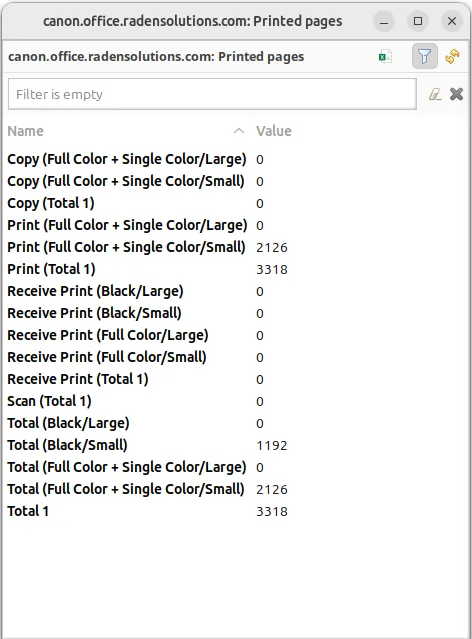
They’re primarily used when it is necessary to gather bulk data, like data sets that can be acquired together or for atomic collection. Atomic collection is when you need to take a data snapshot that consists of multiple items collected at the exact same time.
There are distinct benefits to using table metrics. But they’re not without their disadvantages. As tables are not single values, they require more storage, which can be one of the potential drawbacks.
Furthermore, the threshold configuration can be more complicated for table metrics because they have multiple rows and columns.
Unlike a single value where you can easily specify a threshold for when something is wrong, with a table, you have to specify which instance or item in a column has an issue.
Sources of Table Metrics
Table metrics can be collected from different sources:
- Internal: The server itself collects data such as hardware components, routing table, and more. This data can be obtained from the server as a table metric. It’s useful for displaying on a dashboard or incorporating additional monitoring thresholds and data processing that is not implemented on the NetXMS server.
- NetXMS Agent: Agent tables are provided by different sub-agents. One of the most popular is Dbquery sub-agent — it can return query results as a table. An external table is also one of the sources for agent table metrics.
- SNMP: Simple Network Management Protocol (SNMP) tables provide another source of table metrics.
- Scripts: And another source — the Data Collection Item (DCI) attempts to run a script written in the metric field, expecting that the script will return a class-named table. -> link to the documentation.
The concept of the SNMP Tables
When we do the SNMP walk, the resulting SNMP table item OIDs consist of three parts. For the sake of our explanation, we will mark these parts with the letters:
XXXYYYNNN, where
- XXX is part that does not change — we can call it a Table base OID;
- YYY is part that represents different columns;
- NNN is the instance part. The instance part represents rows in the table.
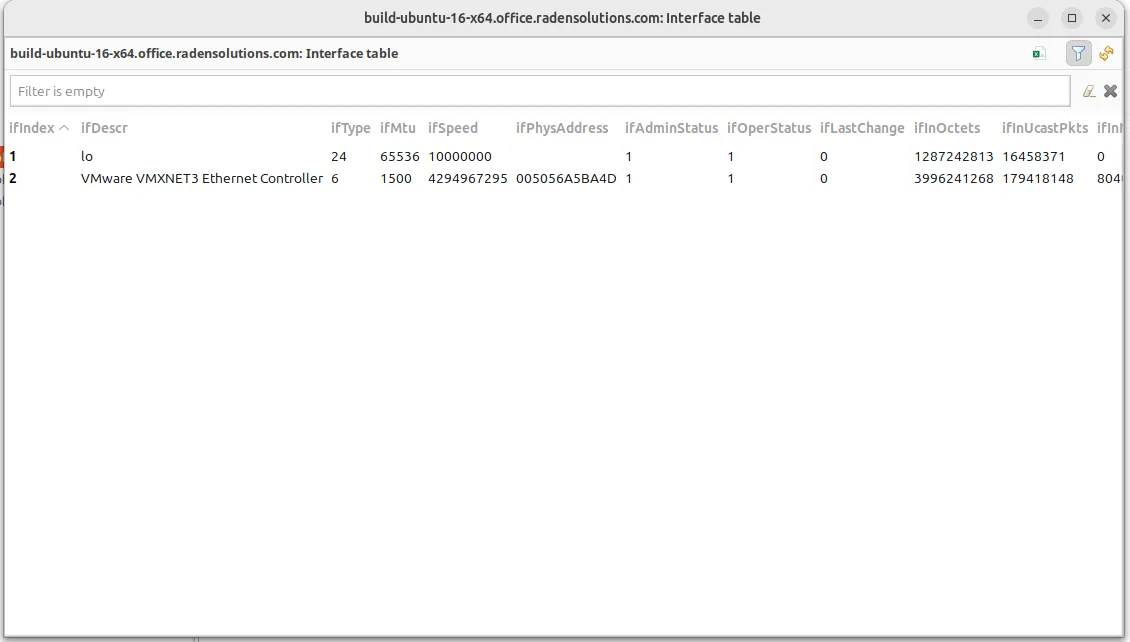
Now, as an example, we can take the table with the base .1.3.6.1.2.1.2.2.1 like the one below:
| .1.3.6.1.2.1.2.2.1 | .1 | .2 | .3 | .4 | .5 | .6 |
| .1 | 1 | lo | 24 | 65536 | 10000000 | |
| .2 | 1 | VMware VMXNET3 Ethernet Controller | 6 | 1500 | 4294967295 | 005056A5BA4D |
In this table the columns are the “YYY” number (that are usually single numbers in ascending order), and the rows are the “NNN” number.
Example:
So, in order to get the “lo” value we should request “.1.3.6.1.2.1.2.2.1.2.1“, where .1.3.6.1.2.1.2.2.1 represent XXX, .2 (the value in the column where “lo” is situated) represents the YYY and .1 (the value in the row where “lo” is situated) represents the NNN.
How to Create a Table
To create a table, use the table base and the column part OID (XXXYYY).
In this way, taking as the example the SNMP table shown above, “1.3.6.1.2.1.2.2.1.1” can be used as the metric for the DCI cofniguration.
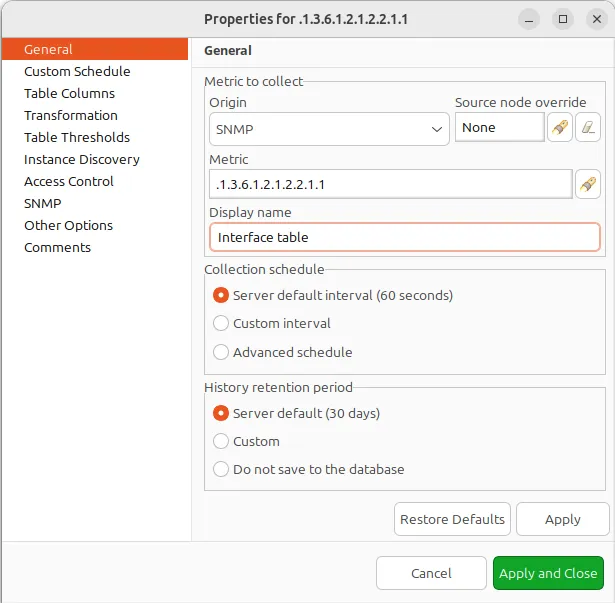
Moreover, we can use any table column in configuration (in the example in the sentence above, we used the “.1” column, as you rightly understood), that returns non-empty results in MIB Explorer, as they will be used to make the SNMP walk to get all the instances.
As for the columns — each of those you’d like to monitor should then be added to the ”Table Columns” property page.
In our case they could be:
- Add index column .1.3.6.1.2.1.2.2.1.1
- Add description .1.3.6.1.2.1.2.2.1.2
- Add Physical address .1.3.6.1.2.1.2.2.1.6
- Add MTU .1.3.6.1.2.1.2.2.1.4…
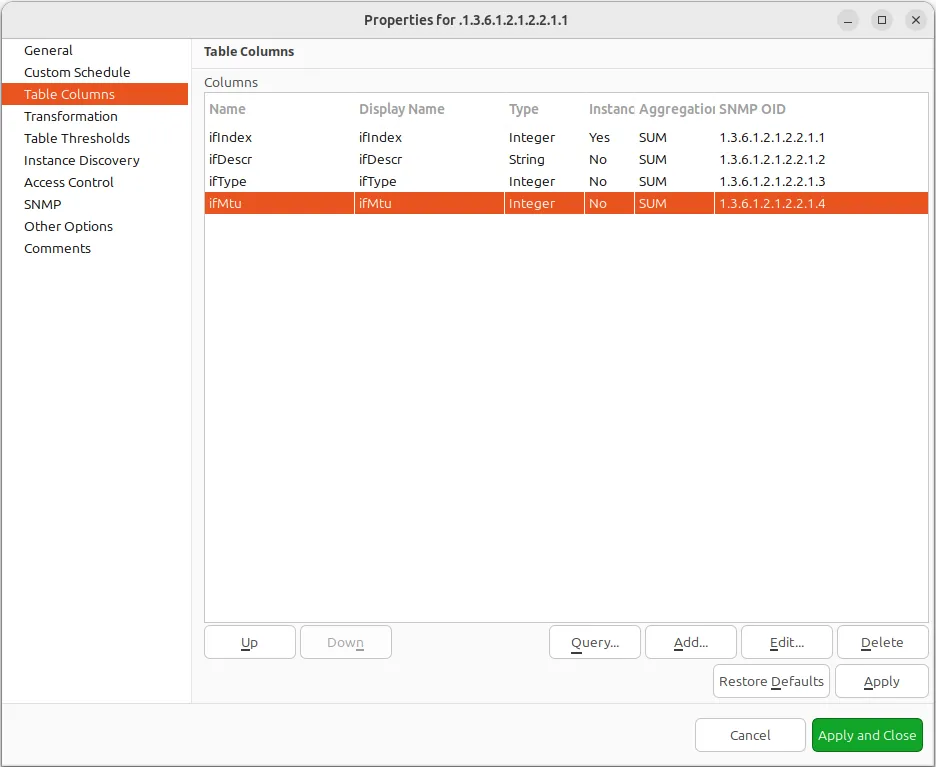
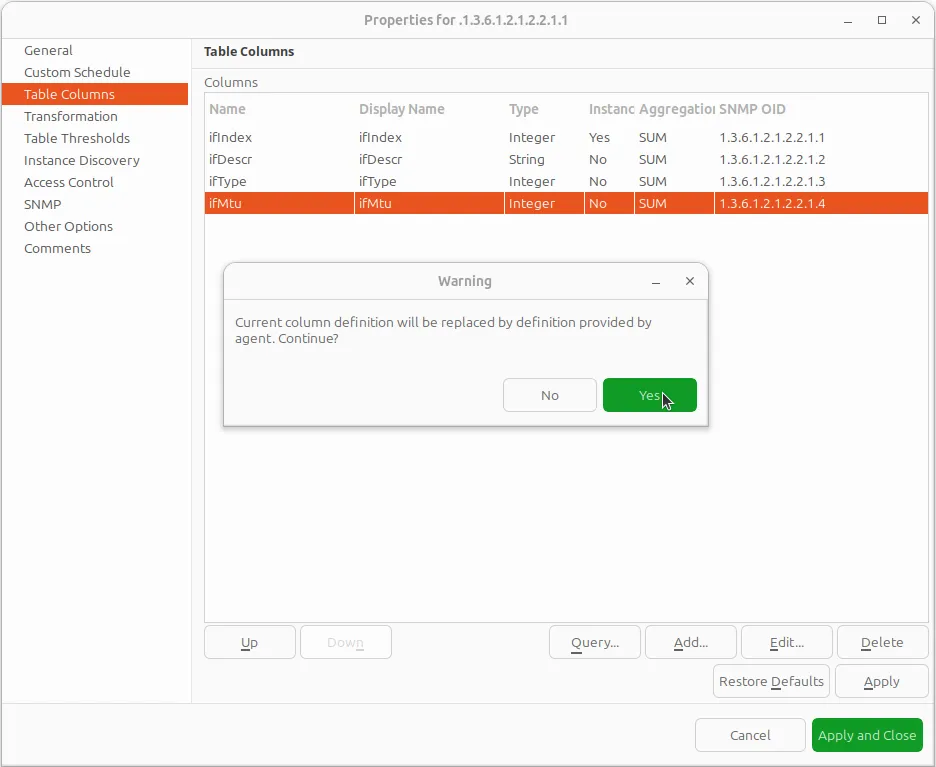
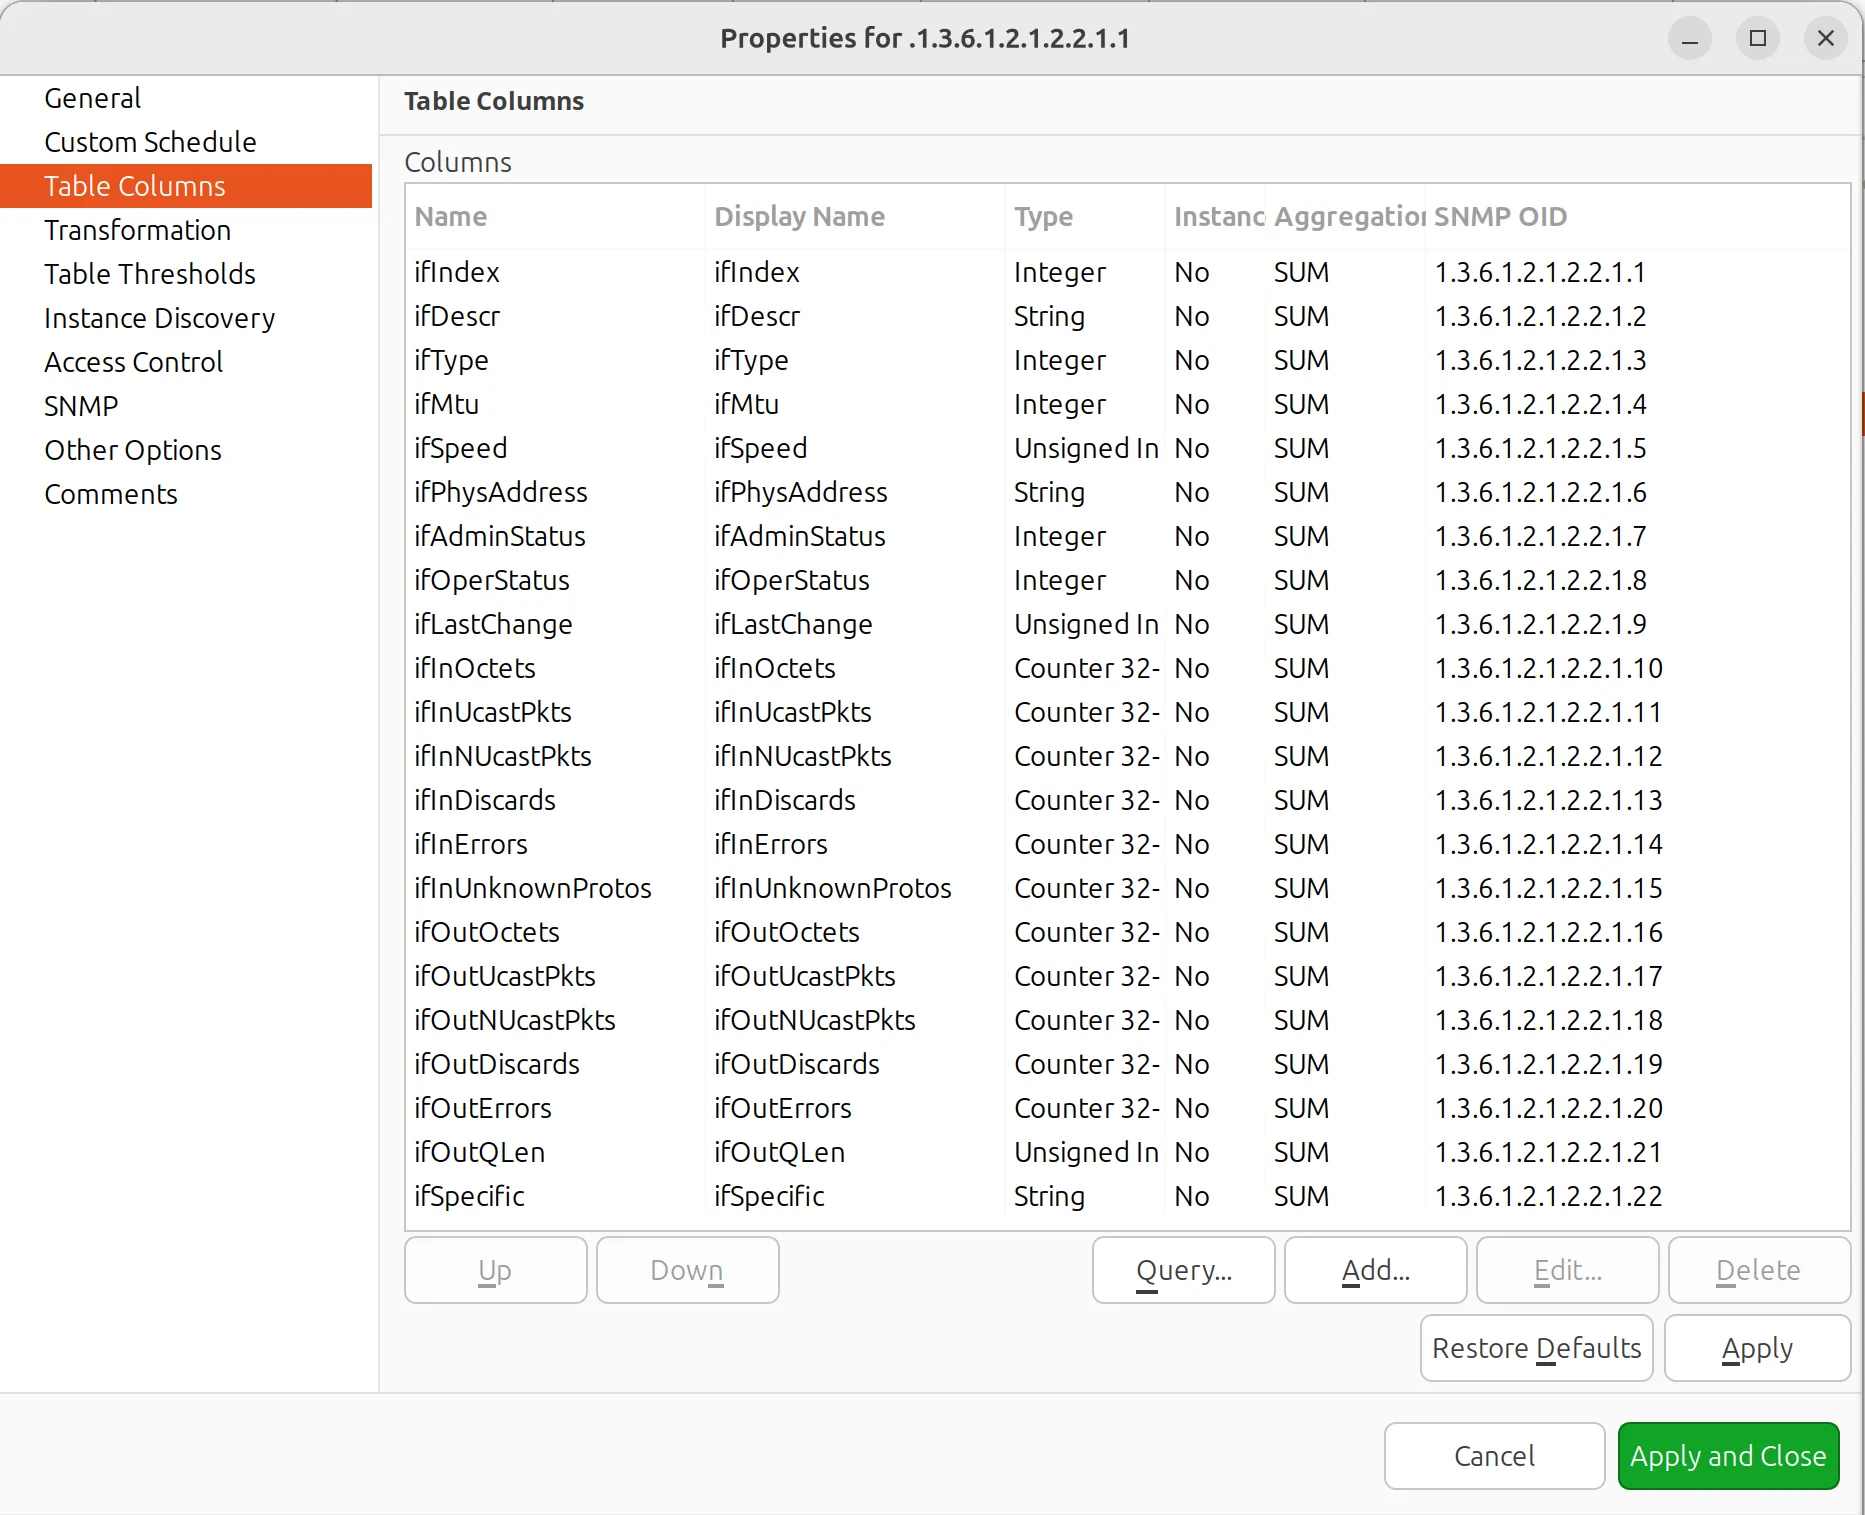
Another option to add columns is to click «Query…» button. Automatic table columns query is done by SNMP walk on Metric OID, where the column part is taken out.
| .1.3.6.1.2.1.4.35.1 |
| .2.1.4.10.5.5.1 |
| .2.1.4.10.5.5.20 |
Look at the table above as another example — it is the table with OIDs for Physical address.
We can see in the table above that the instance OID can also be a string of multiple numbers with dots. In the case of a physical address map instance, OID part will contain IP address.
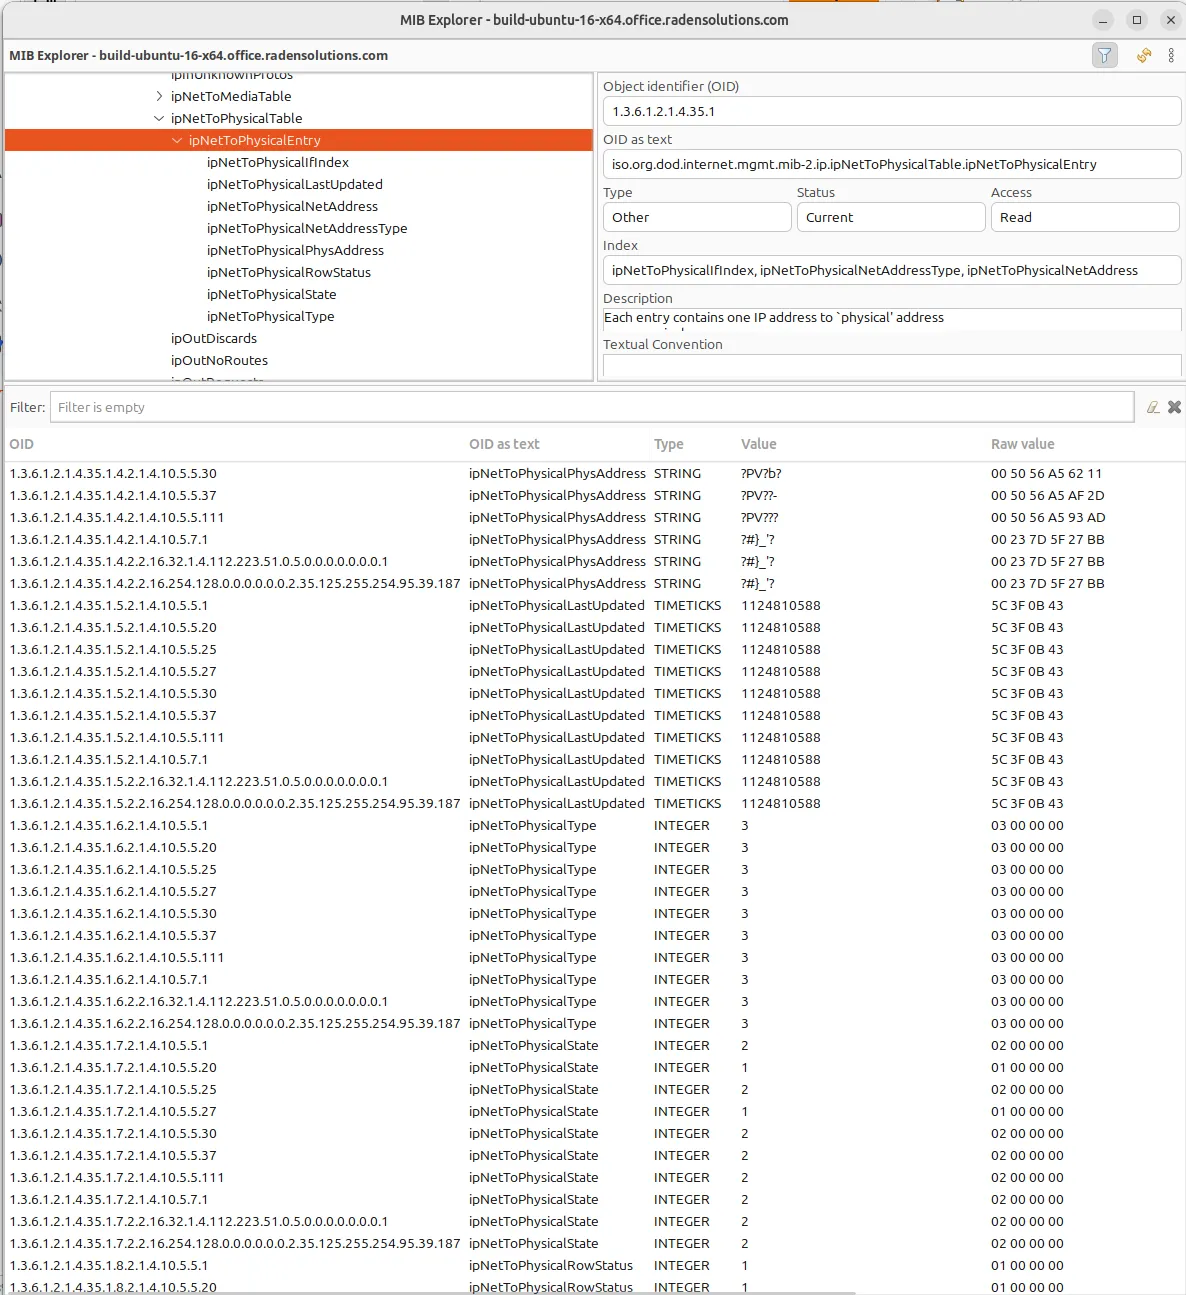
Another difference with the first example can be determined by executing the SNMP walk for the table above. The device returns values only for the columns with the OIDs “.4”, “.5”, “.6”, “.7”, “.8”.
If we do walk for the “1.3.6.1.2.1.4.35.1.1” table column, it will return us empty result. This also should be taken into consideration when we create a table with physical addresses – only columns that return indexes can be used for the Metric field in the DCI Table creation property page.
Table Thresholds and Instance Columns
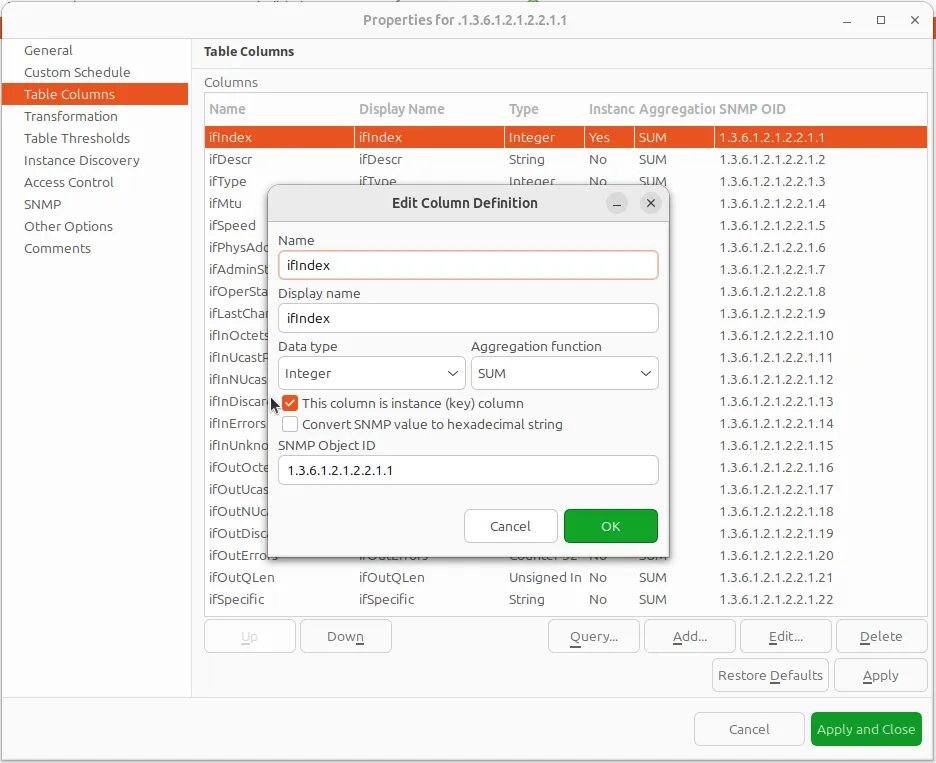
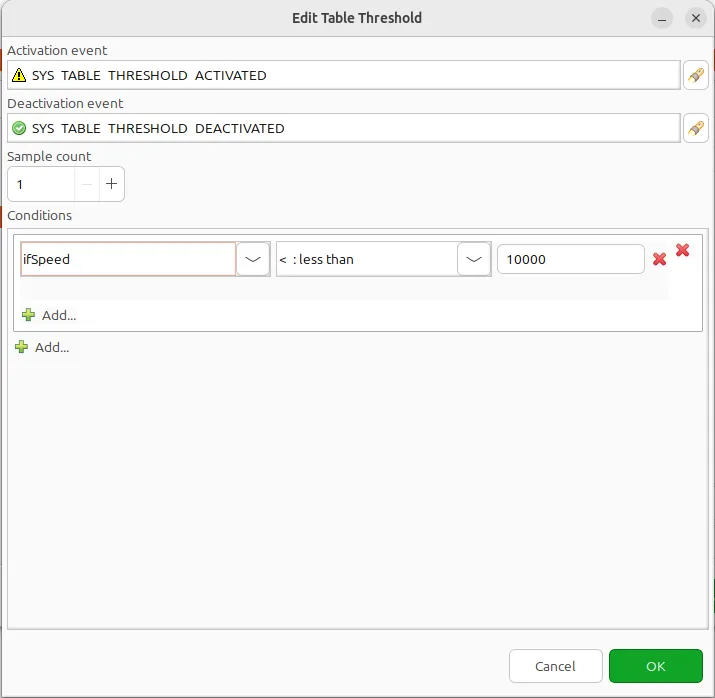
When setting up table thresholds, it’s helpful to understand instance columns. An instance column is similar to a primary key in a database — it’s the unique ID.
In NetXMS, this is known as an instance- or key column. It is possible to set multiple columns as instance columns, similar to composite keys in databases.
However, if instance columns aren’t defined, and rows change order between polling periods, it can trigger false threshold alerts.
The system might register that a different row is exceeding a threshold when, in fact, the same data is present, just in a different row. Specifying an instance column can mitigate this confusion.
As you see, the NetXMS table metrics are a powerful tool for collecting and managing a wealth of network data. While they can be more complex to set up and require more storage than single with similar content, they present a great possibility to view more complex sets of data.
How to Configure Table Metrics in NetXMS?
In order to show how table metrics are configured in NetXMS, and how to distinguish what each part of it represents, we will go to the MIB explorer and use one of the tables in the system.
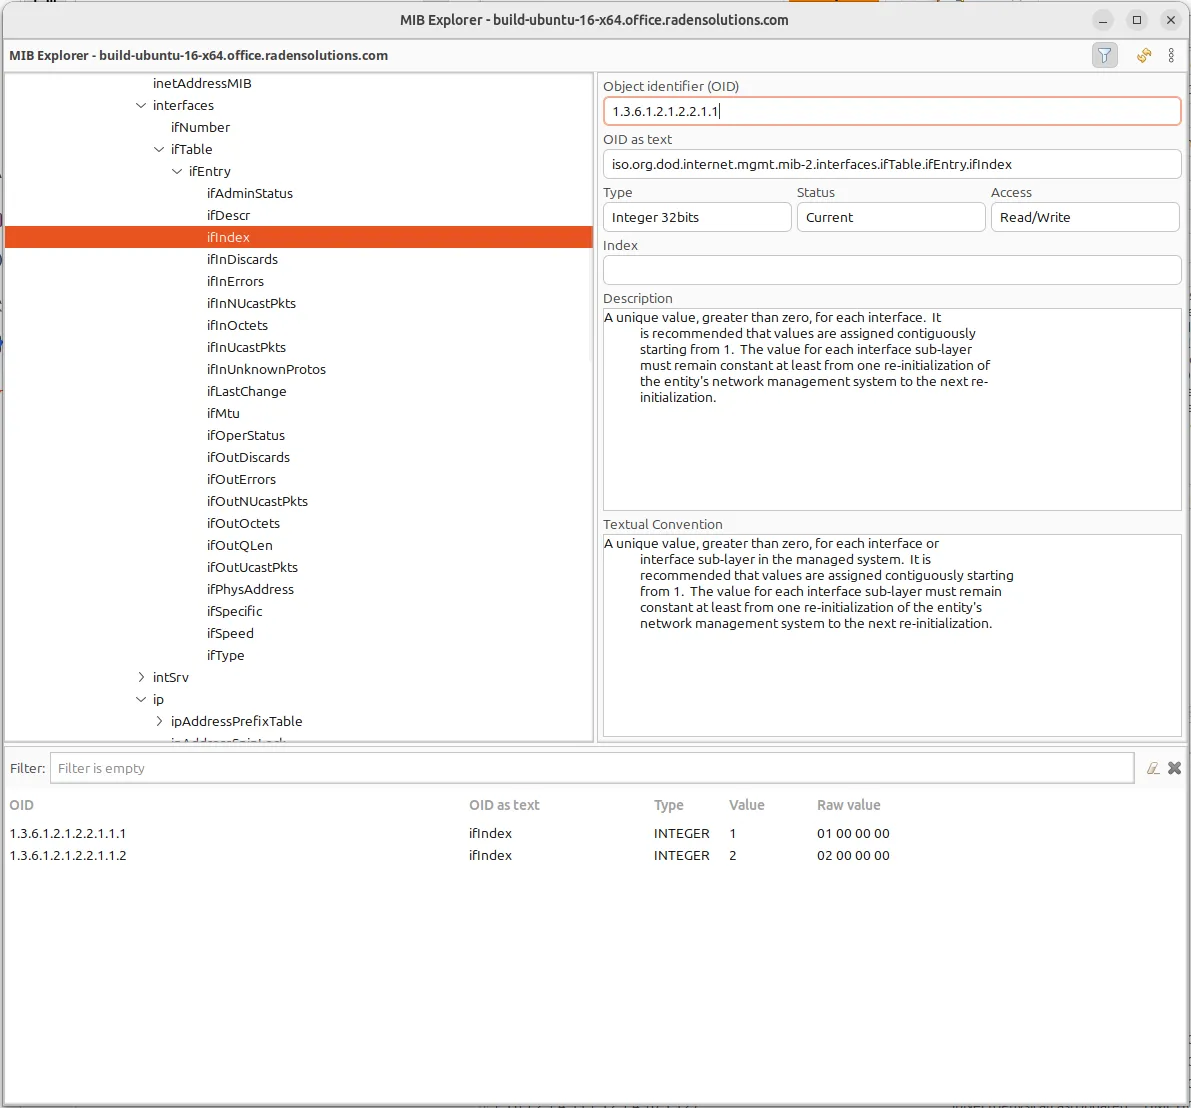
In this picture we see the table OID “1.3.6.1.2.1.2.2.1”. After the “1.3.6.1.2.1.2.2.1” goes “.1”, that represents the column OID (refer to the earlier section of this article with the XXXYYYNNN example explained).
In the OID search field there is “1.3.6.1.2.1.2.2.1.1” — the table column OID. As a result of the MIB walk for the given OID we get two instances “1.3.6.1.2.1.2.2.1.1.1” and “1.3.6.1.2.1.2.2.1.1.2”.
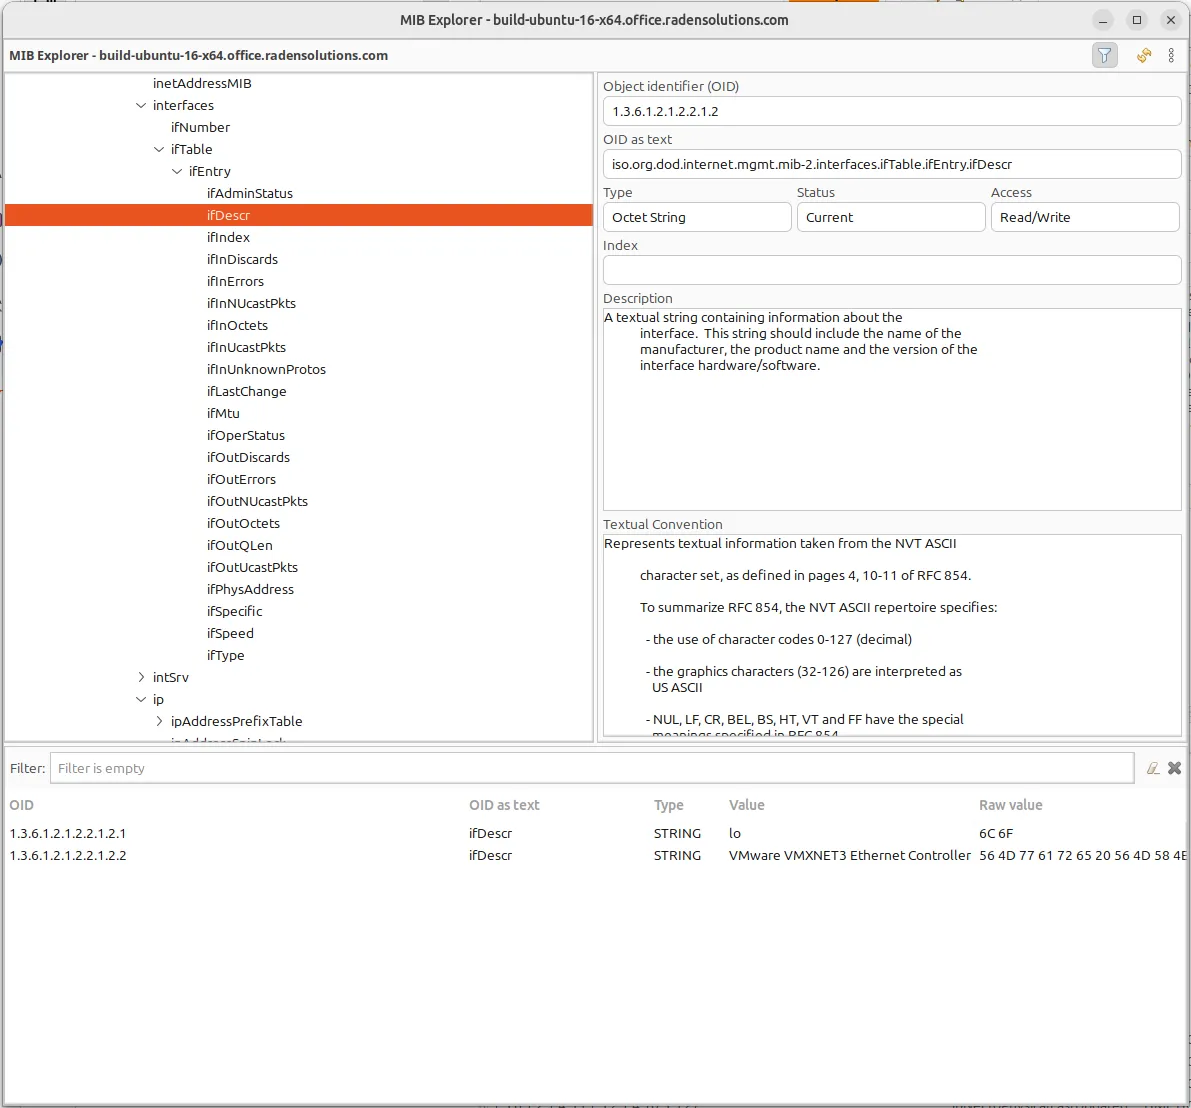
We can make the MIB walk for another table column “1.3.6.1.2.1.2.2.1.2” and get the same two instances, just for another column: “1.3.6.1.2.1.2.2.1.2.1” and “1.3.6.1.2.1.2.2.1.2.2”.
In this way, we know now, that the table base ID is “1.3.6.1.2.1.2.2.1.2”.
To configure this table we can use any table column, that via a MIB walk will return the instances — like “1.3.6.1.2.1.2.2.1.1” or “1.3.6.1.2.1.2.2.1.2”.
Let’s use “1.3.6.1.2.1.2.2.1.1”.

Then let’s go to the Table Column configuration property page and do a query. It will add all the columns to the table list.

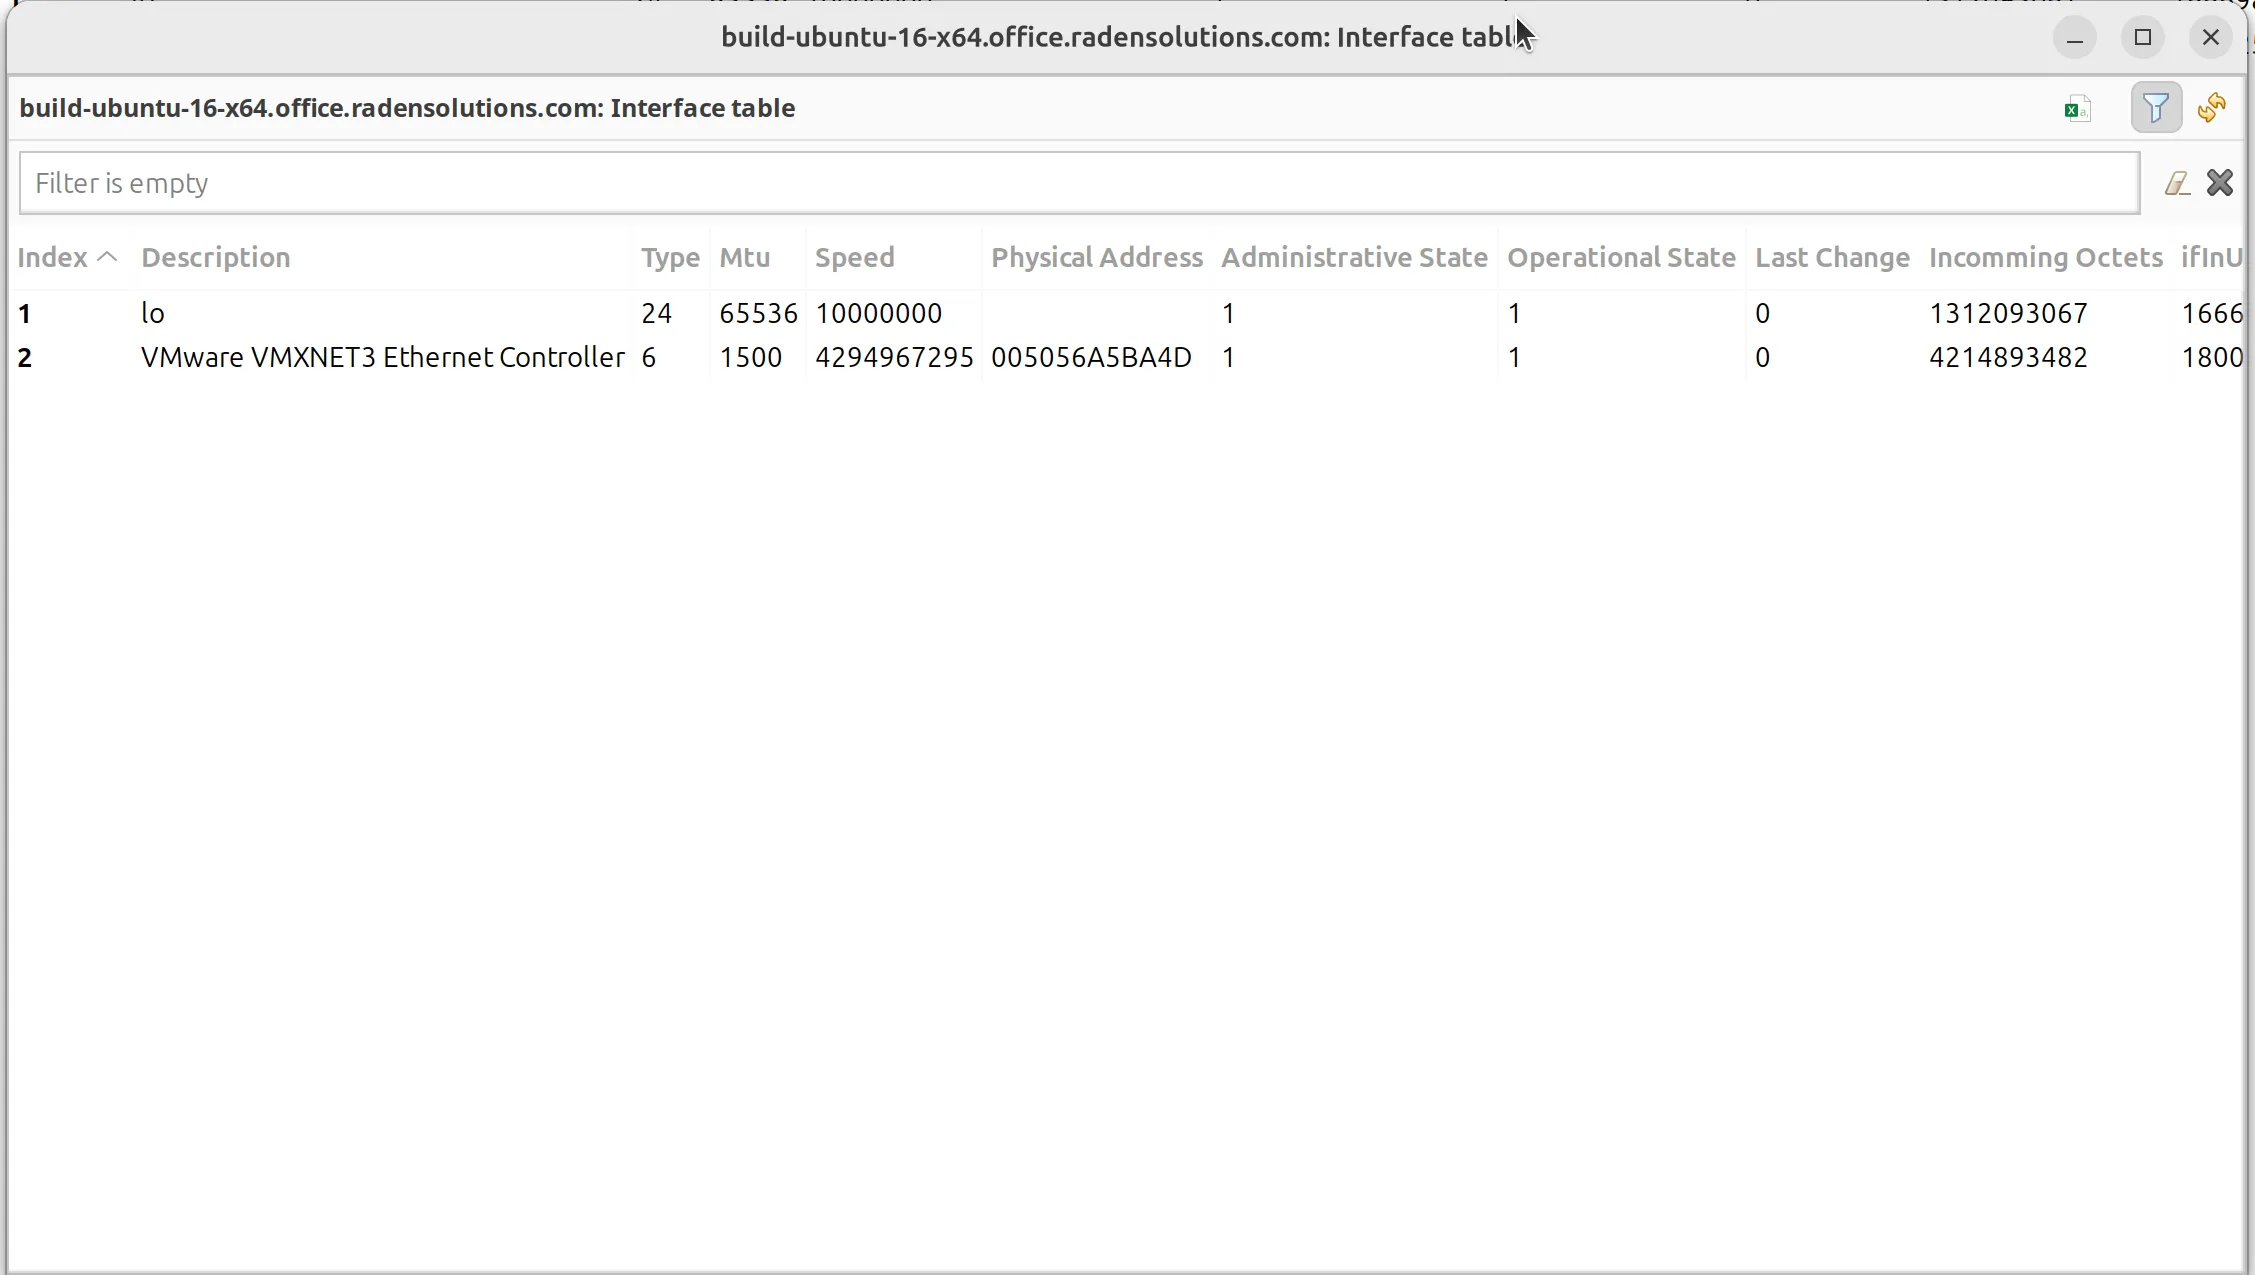
Now we have a table with all the columns. Columns can be renamed by a user afterward, if necessary. What we are missing here is an instance column. Out instance column will be the “ifIndex” column.
The end-result will look like the table below:
Looking for more tips? Refer to our detailed documentation on the Table Metrics here.

