
This article walks through the configuration process for using Grafana within NetXMS API, enabling seamless visualization of critical monitoring data.
Enable web api
First, the initial step is to enable the Web API module in the NetXMS server configuration. This module allows external applications, like Grafana, to communicate with NetXMS and retrieve monitoring data through RESTful API calls.
Module = webapi
This line in the netxmsd.conf file will enable the Web API module on the server, which by default listens on port 8000.
The port can be changed using the configuration parameter:
        [WEBAPI]

ListenerPort = 8000
It is recommended to install a reverse proxy solution like Nginx to enable SSL encryption.
Installing the Infinity Plugin in Grafana and Configuring the Connection to the NetXMS Web Service API
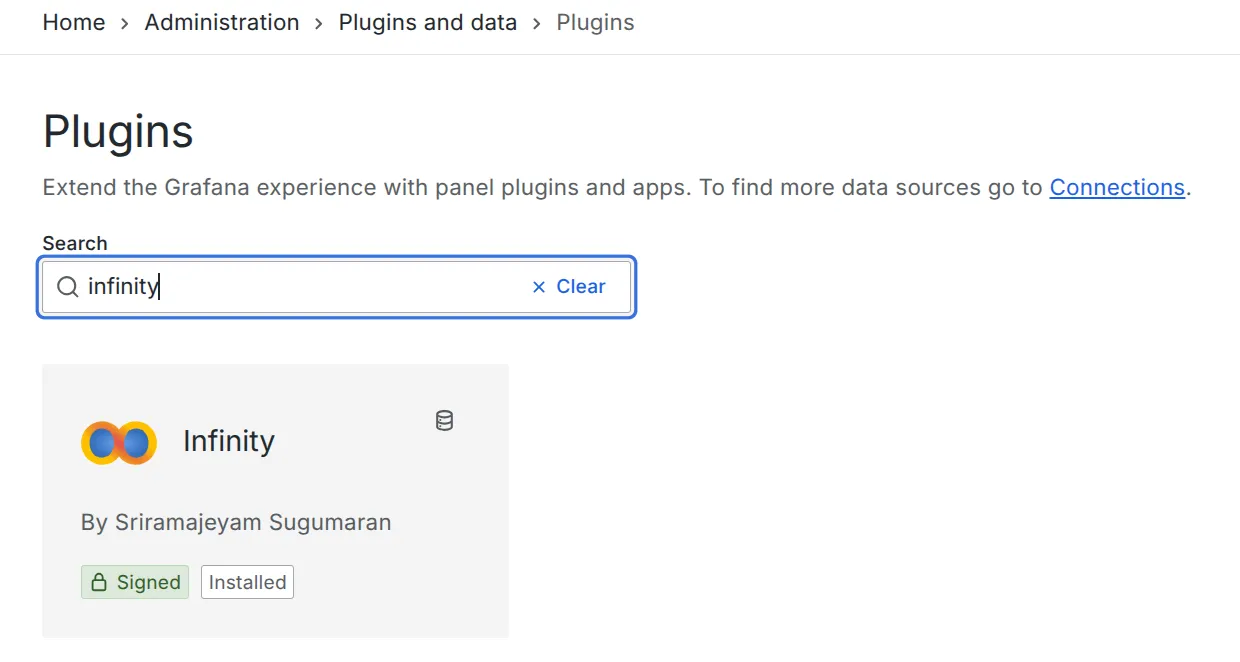
First, install the Infinity plugin from the Grafana plugin marketplace, and then configure a new data source for the NetXMS API.
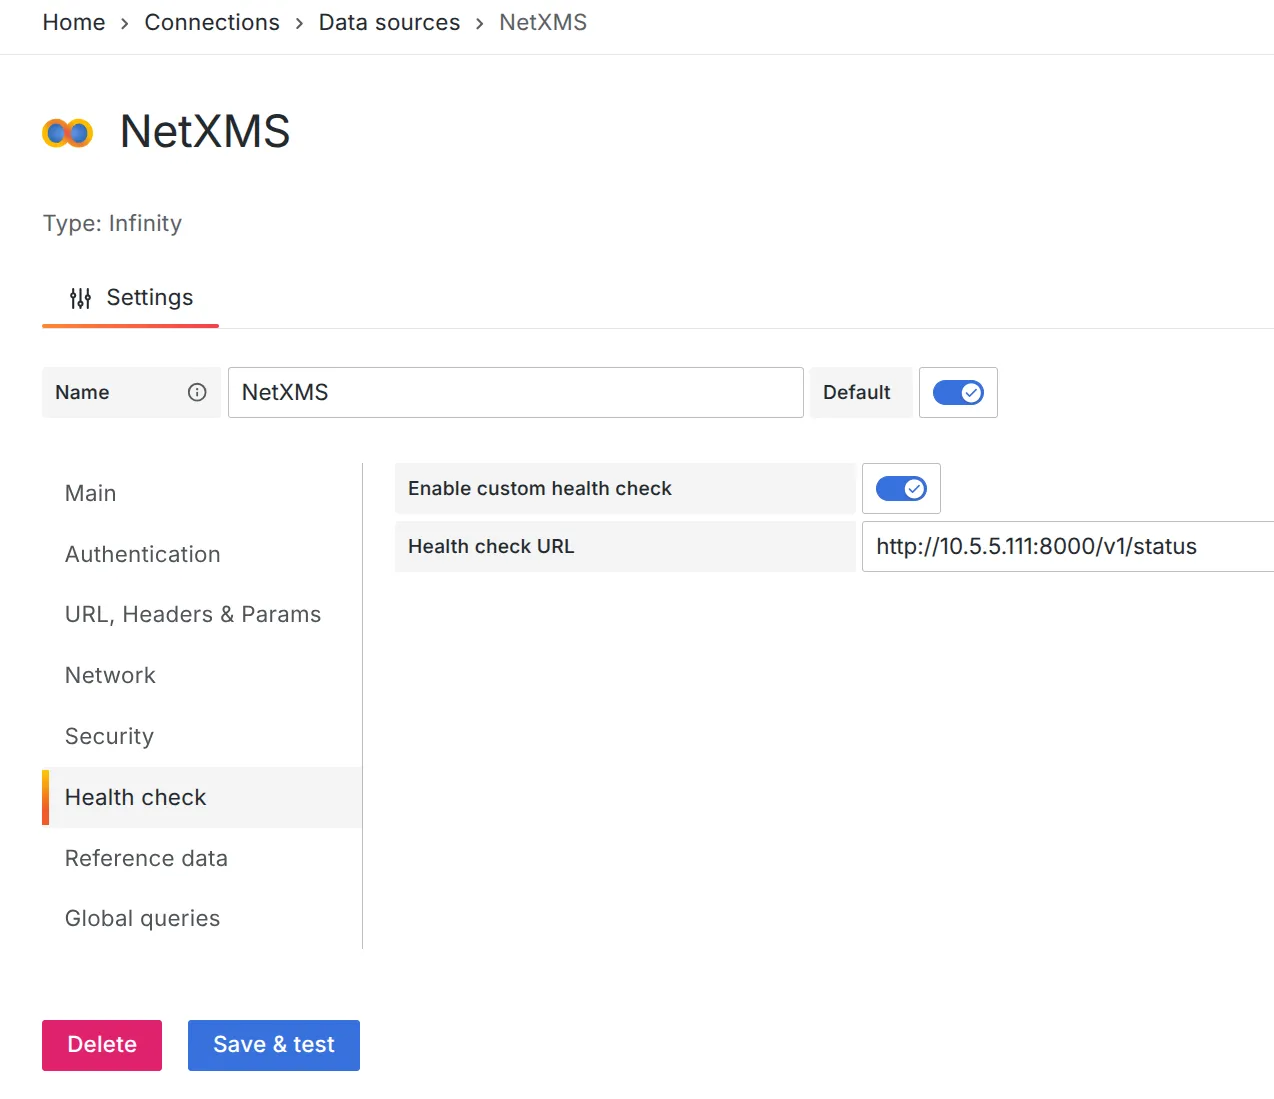
- A Bearer Token should be used to authenticate with the API. The token can be obtained by selecting a user in the Users view and choosing “Issue authentication token…” from the right-click menu.
- The API address must be added to the Allowed Hosts section.
- The /v1/status endpoint can be used to configure a health check for the data source.
Alarms
The Alarms endpoint provides alarm data for a specific part of the object tree or for the entire system if no object is provided. If no specific object is defined, it defaults to system-wide alarms.
Request info
-
Request: POST
-
URL: v1/grafana/infinity/alarms
-
Data:
- JSON data can be empty or can contain root object id, to show all alarms under a specific root.
- Example JSON data:
{
  "rootObjectId": 2
}
Example
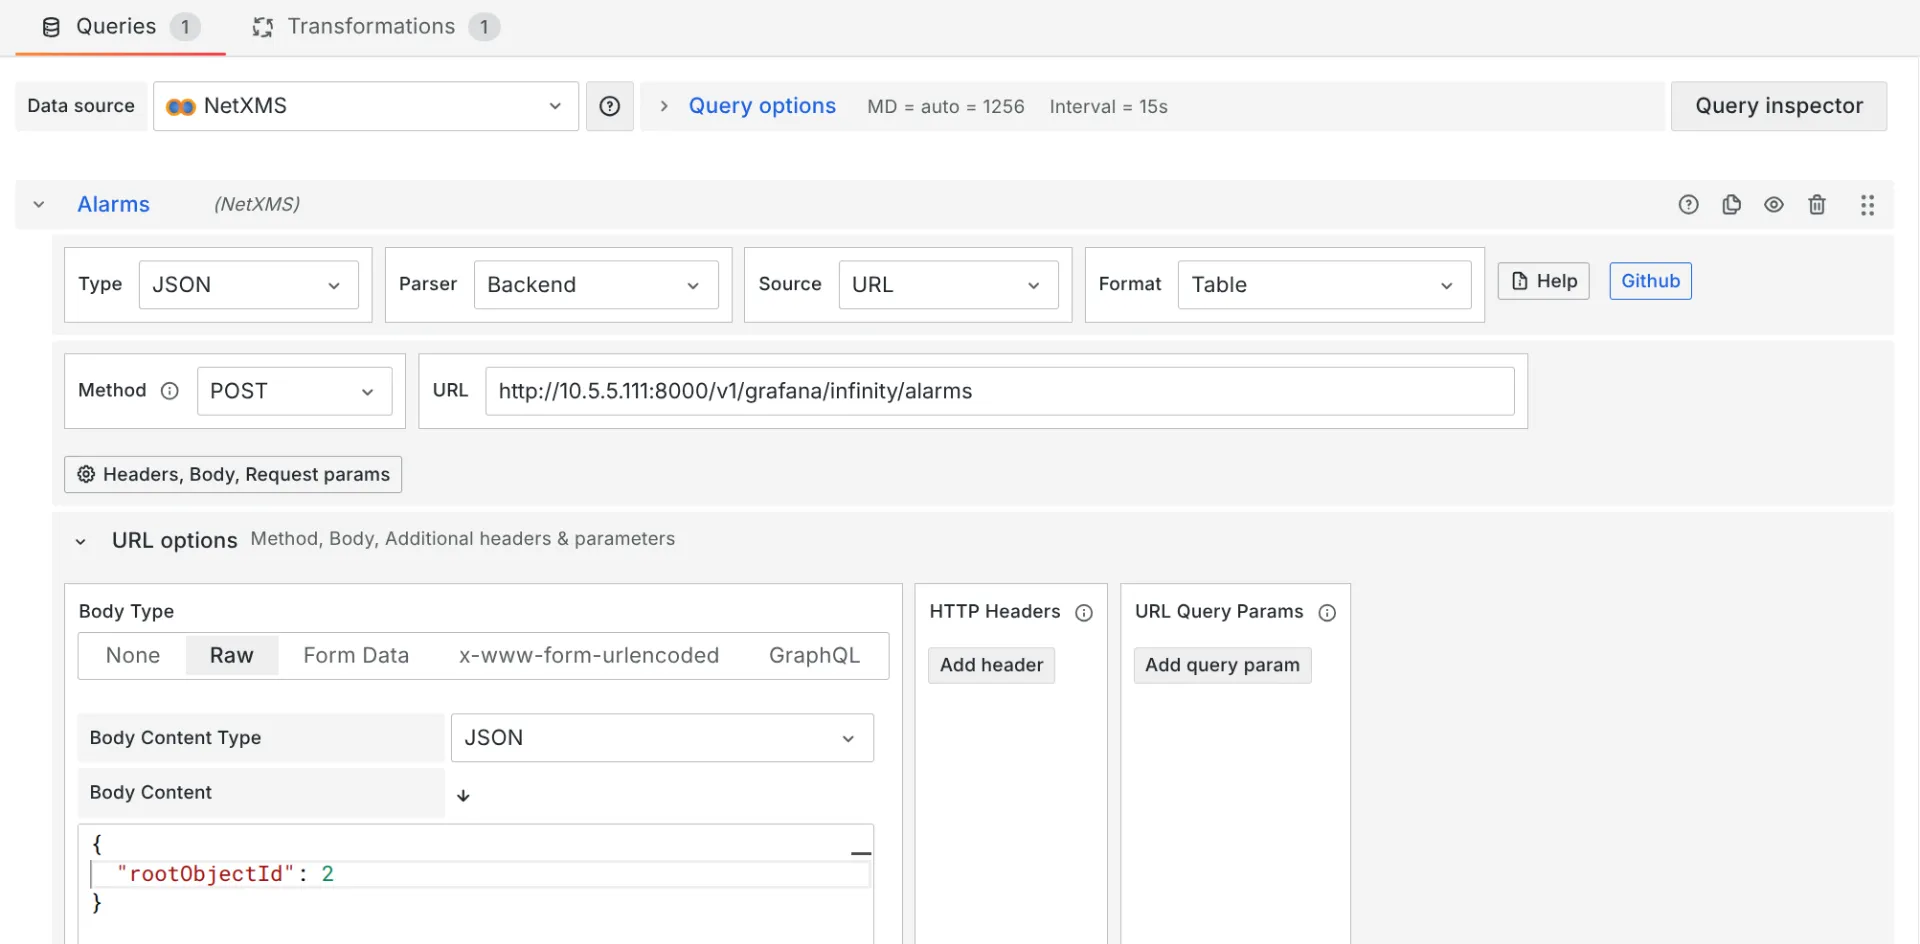
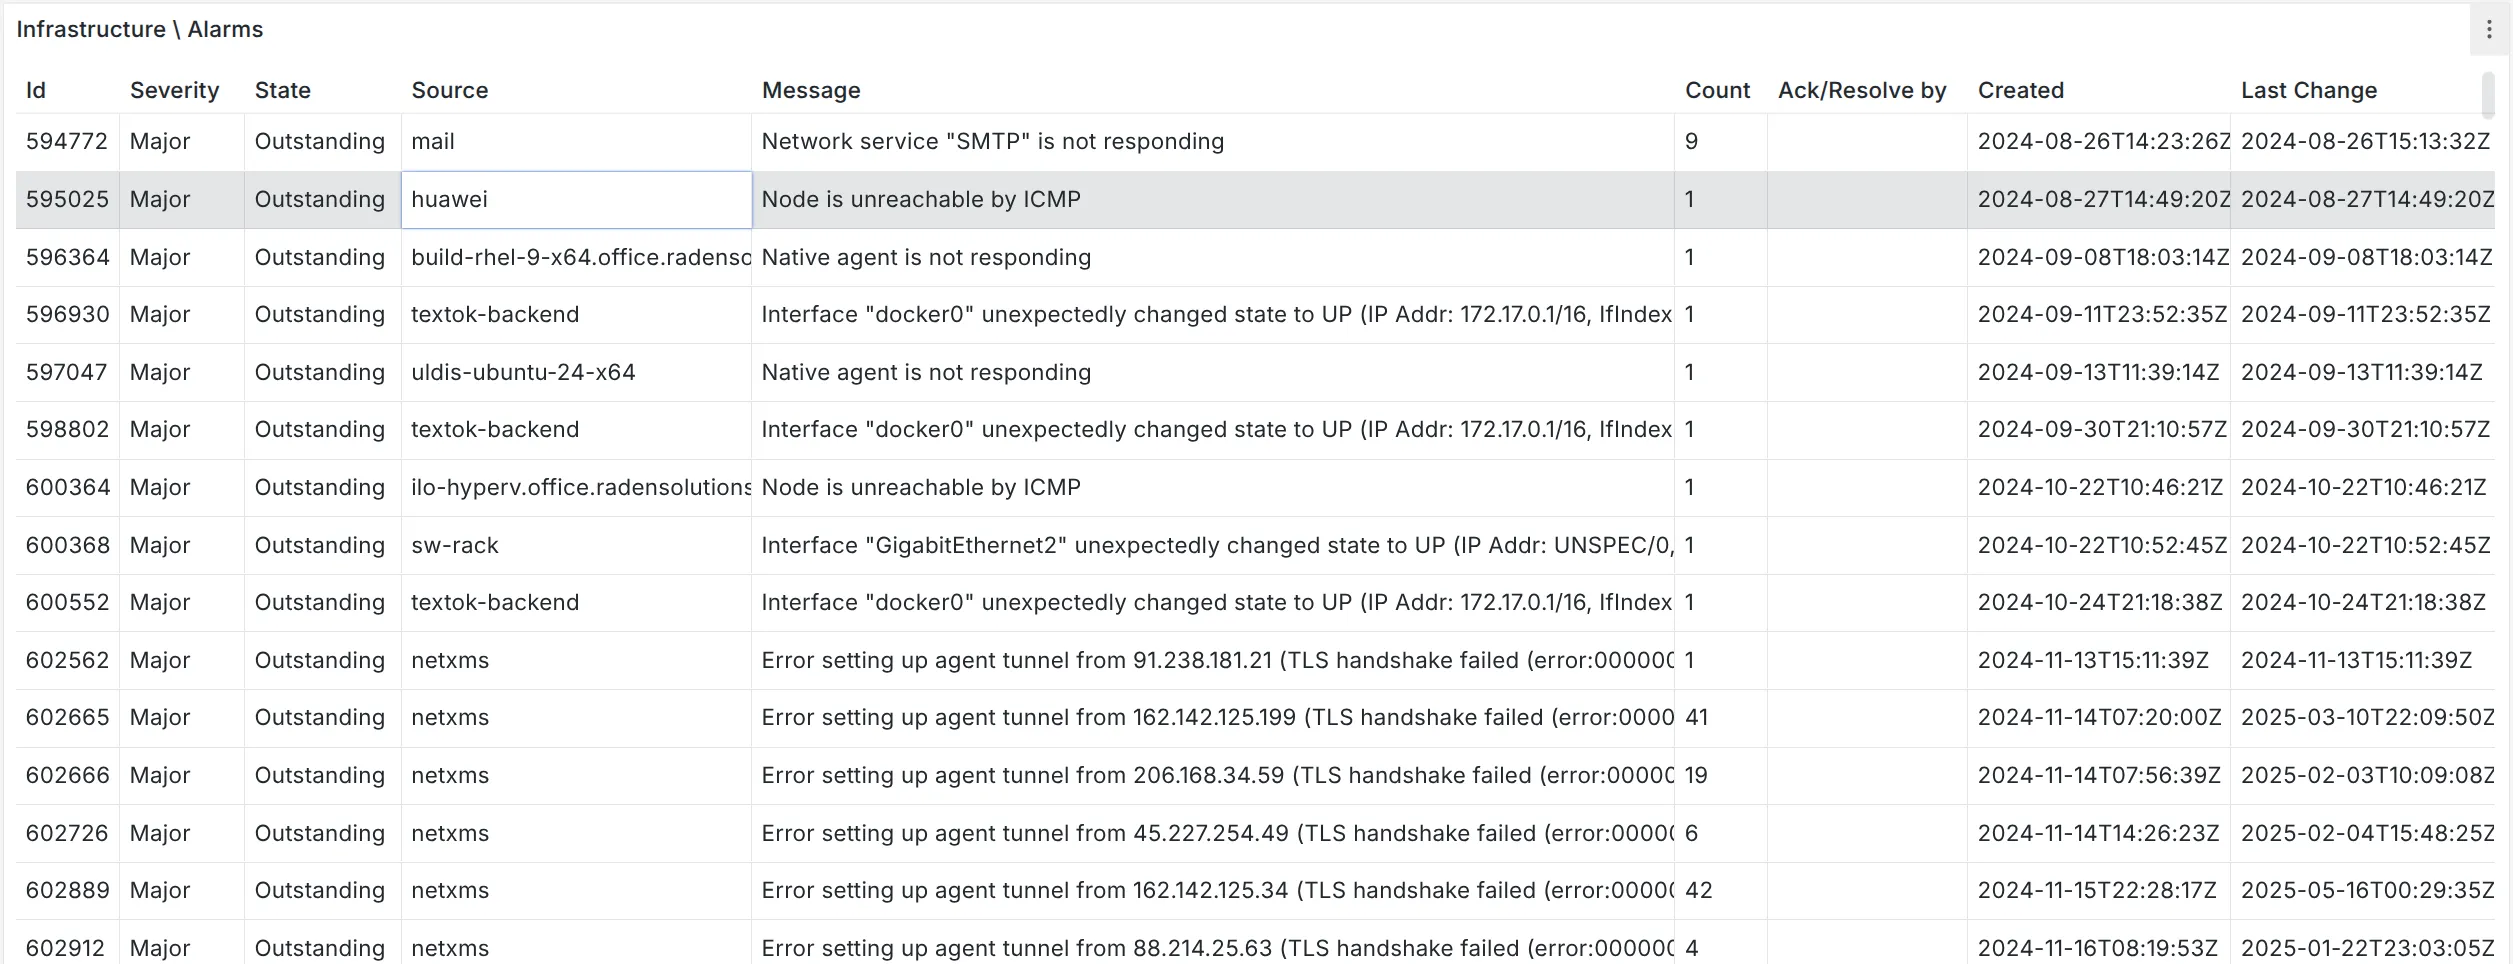
In this example, we configured the system to retrieve all alarms under the ‘Infrastructure’ container, which has an object ID of 2.
Grafana configuration:
- Visualization: Table
- Method: POST
- URL: http://server_address:server_port/v1/grafana/infinity/alarms
- Request JSON data:
{"rootObjectId" : 2}
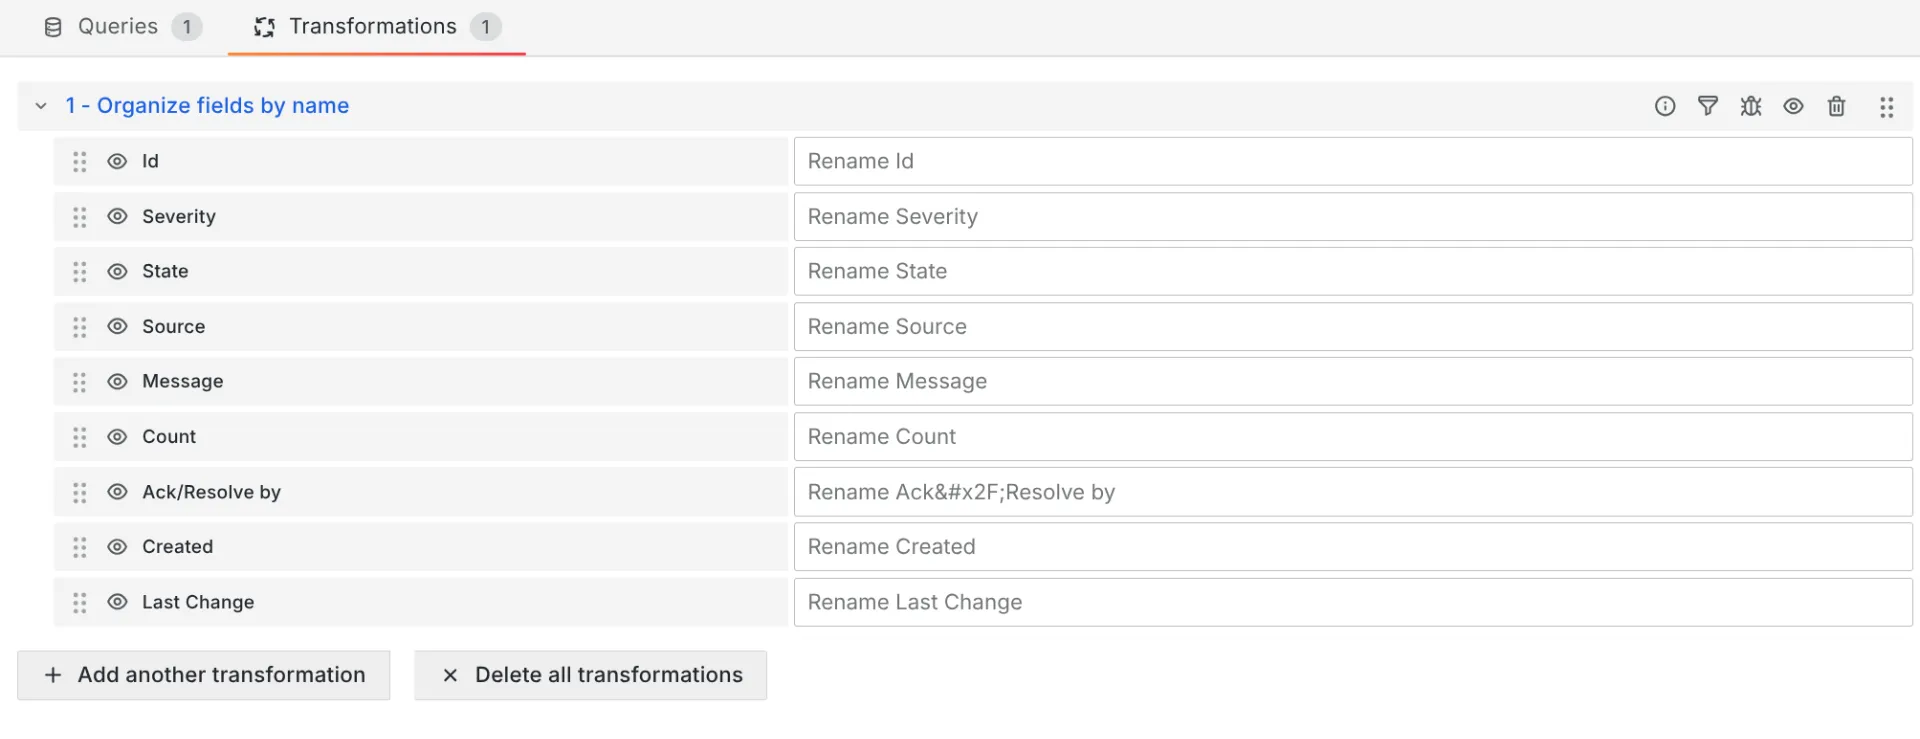
By default, Grafana sorts columns alphabetically. To arrange them in the same order as in NetXMS, we use the “Column order” data transformation.
Object Queries
The Object Query endpoint provides an option to retrieve the result of a predefined query. Columns and their names should be defined in the Object Query script.
Request info
-
Request: POST
-
URL: v1/grafana/infinity/object-query
-
Data:
- Minimal JSON configuration is
queryId- id of saved object query. - Additionally,
rootObjectIdand user-provided query values viainputFieldscan be configured. - Example JSON data:
{
  "rootObjectId": 2,
  "queryId": 1,
  "inputFields": {
    "name": "value",
    "anotherField": "anotherValue"
  }
}
- Minimal JSON configuration is
Example
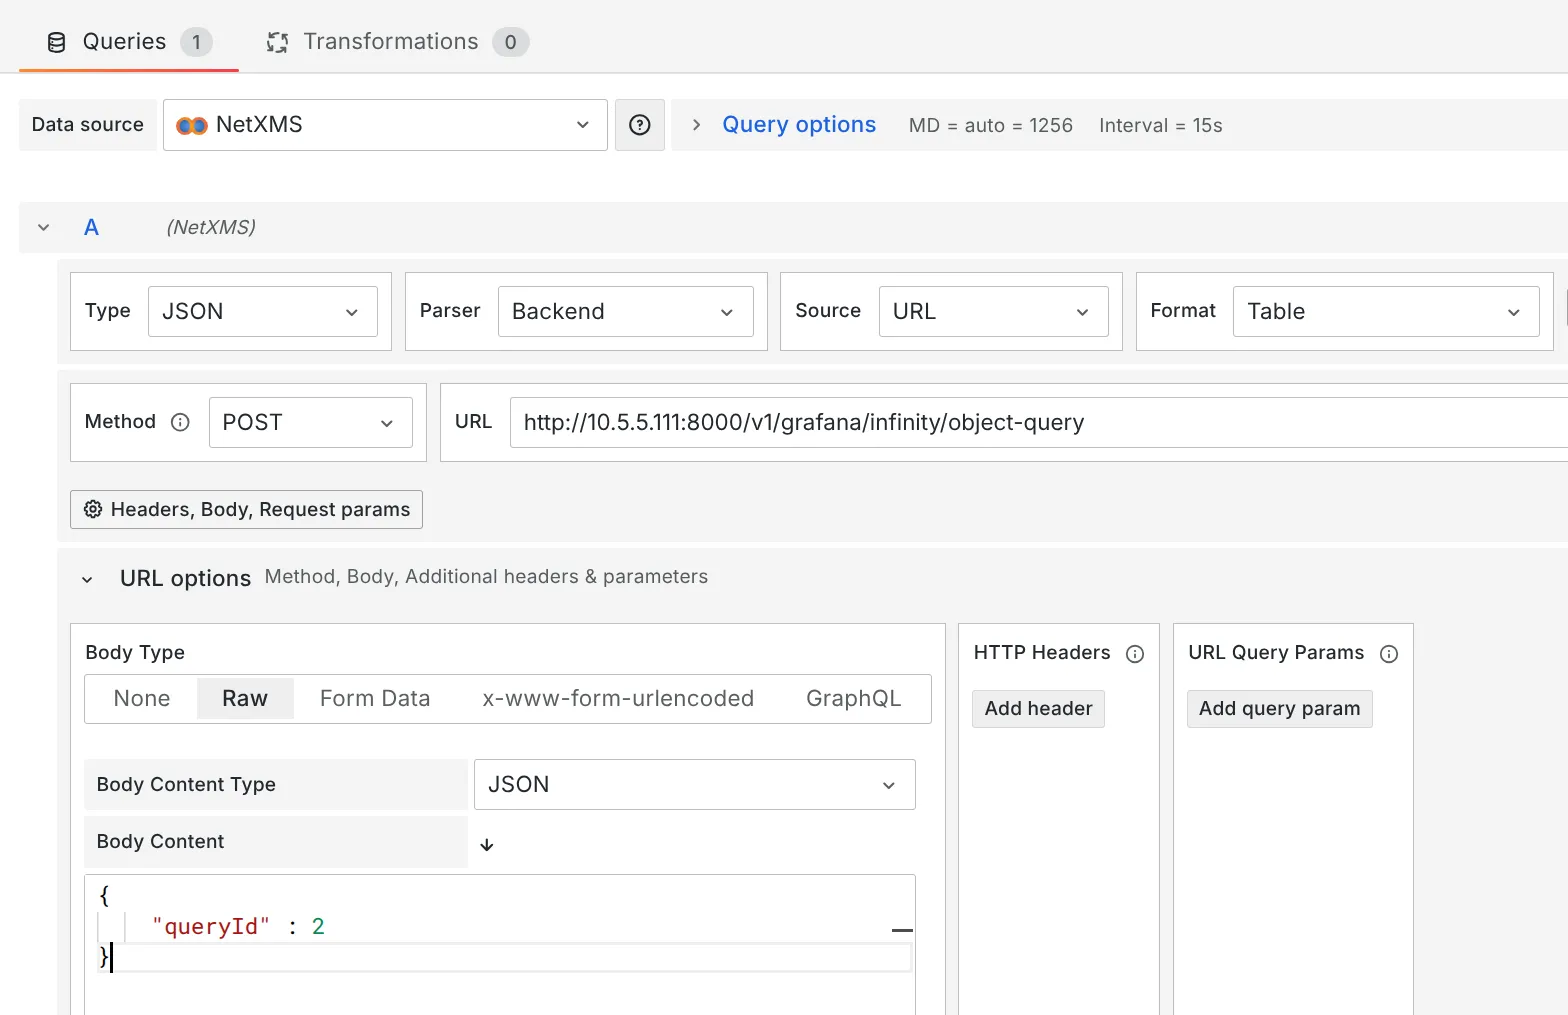
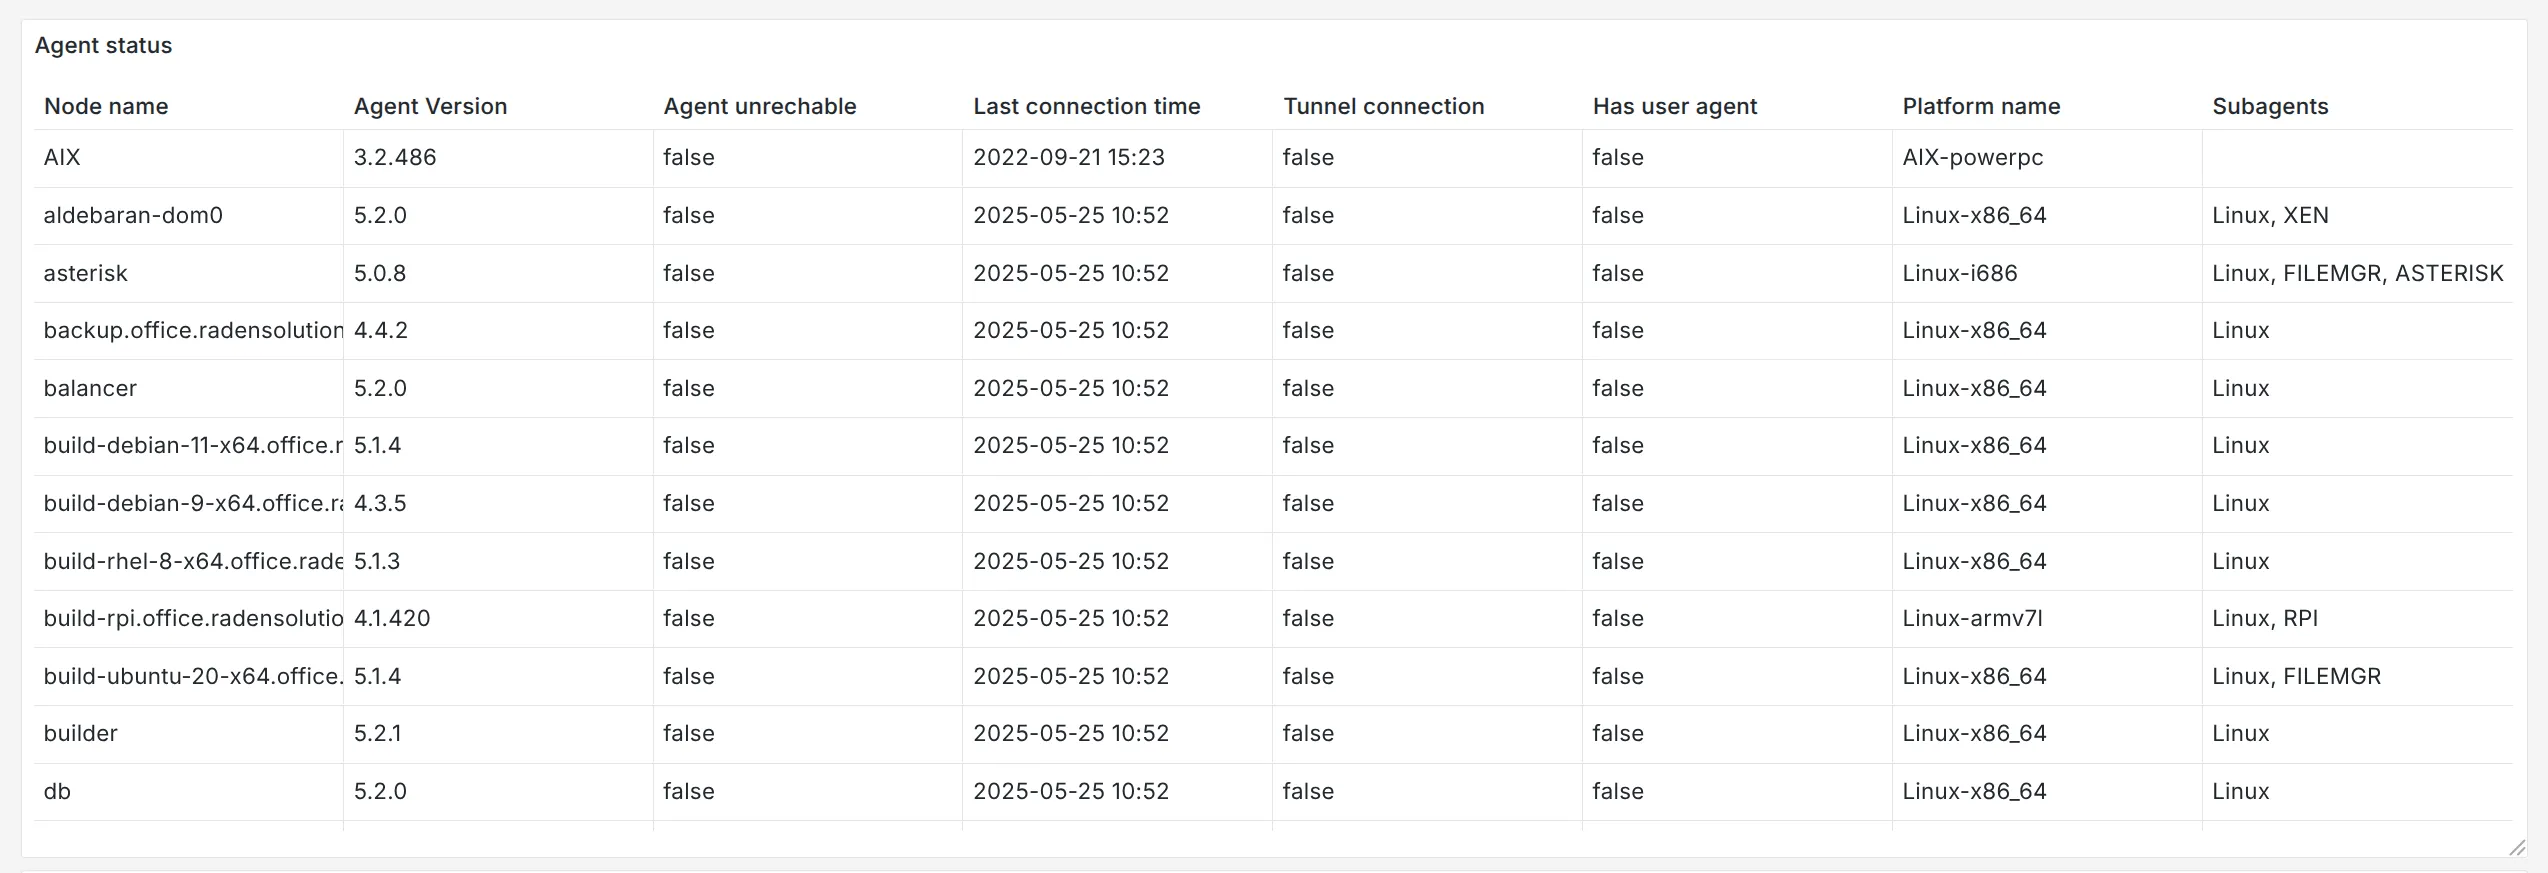
In this example, we created an object query that displays NetXMS agent information for nodes with an agent. The query was created on the NetXMS server, and its ID is 2.
The NXSL script for the query looks like this:
with
nodeName (name = "Node name", order = "asc") = {
$node.name
},
agentVersion (name = "Agent Version") = {
$node.agentVersion
},
agentUnreachable (name = "Agent unreachable") =
{
$node.state == NodeState::AgentUnreachable
},
lastCommTime (name = "Last connection time") = {
DateTime($node.lastAgentCommTime).format("%Y-%m-%d %H:%M")
},
tunnelConnected (name = "Tunnel connection") = {
$node.tunnel != null
},
hasUserAgent (name = "Has user agent") = {
$node.hasUserAgent
},
platformName (name = "Platform name") = {
$node.platformName
}
,
subagents (name = "Subagents") = {
result = "";
if ($node.state == NodeState::AgentUnreachable || $node.state == NodeState::Unreachable)
return result;
table = $node.readAgentTable("Agent.SubAgents");
for(i = 0; table != null && i < table.rowCount; i++)
{
for(j = 0; j < table.columnCount; j++)
{
if (table.getColumnName(j) ilike "name")
{
result ..= table.get(i, j);
break;
}
}
if (i+1 != table.rowCount)
result ..= ", ";
}
return result;
}
(type == NODE) and $node.isAgent
Grafana configuration:
- Visualization: Table
- Method: POST
- URL: http://server_address:server_port/v1/grafana/infinity/object-query
- Request JSON data:
{"queryId" : 2}
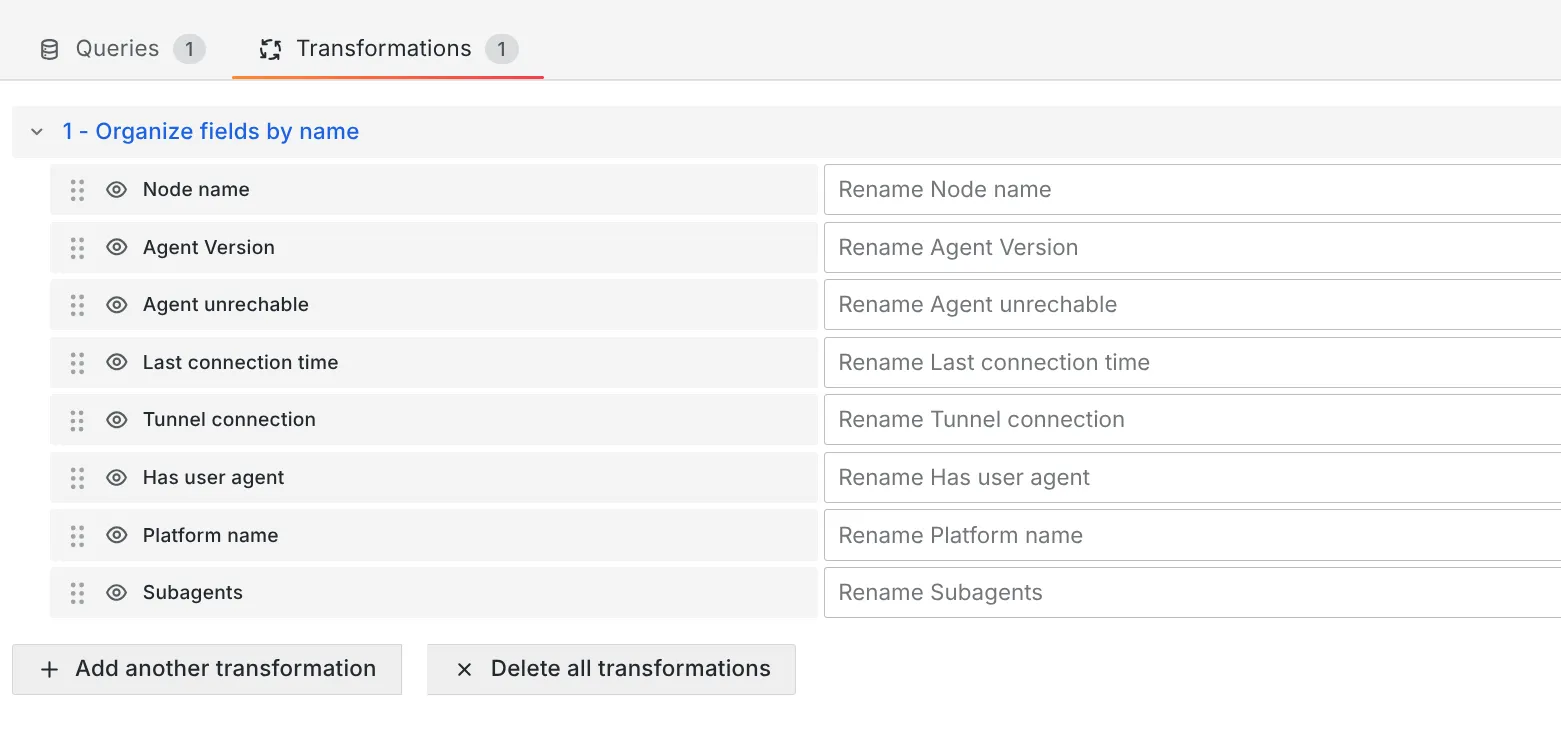
By default, Grafana sorts columns alphabetically. To arrange them in the same order as they appear in NetXMS, you should use the “Column Order” data transformation.
Summary Tables
The summary table endpoint provides an option to retrieve the summary table execution result. The API returns the same information as the NetXMS summary table UI.
Request info
-
Visualization: Table
-
Request: POST
-
URL: v1/grafana/infinity/summary-table
-
Data:
- The root object is the object on which the summary table will be executed. Both the root object ID and the table ID are required fields.
- JSON data:
{
  "rootObjectId": 2,
  "tableId": 1
}
Example
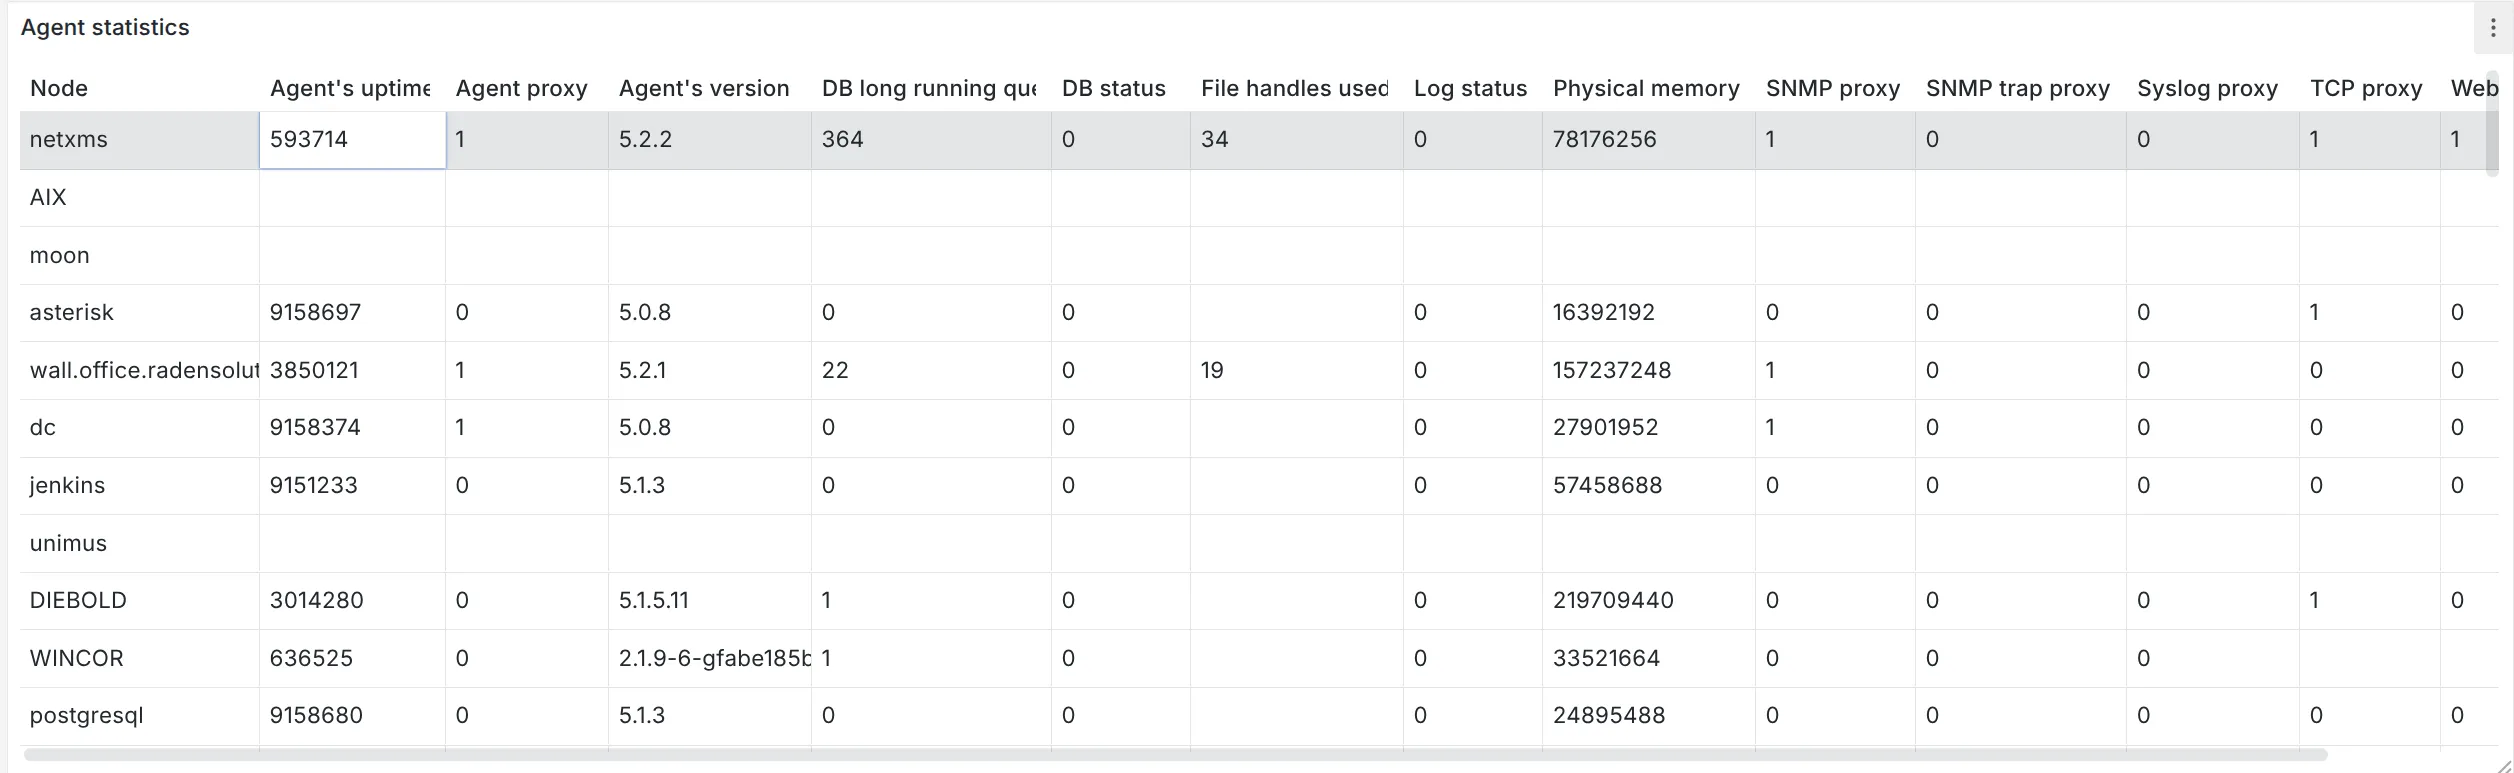
In this example, we created a summary table displaying agent statistics.
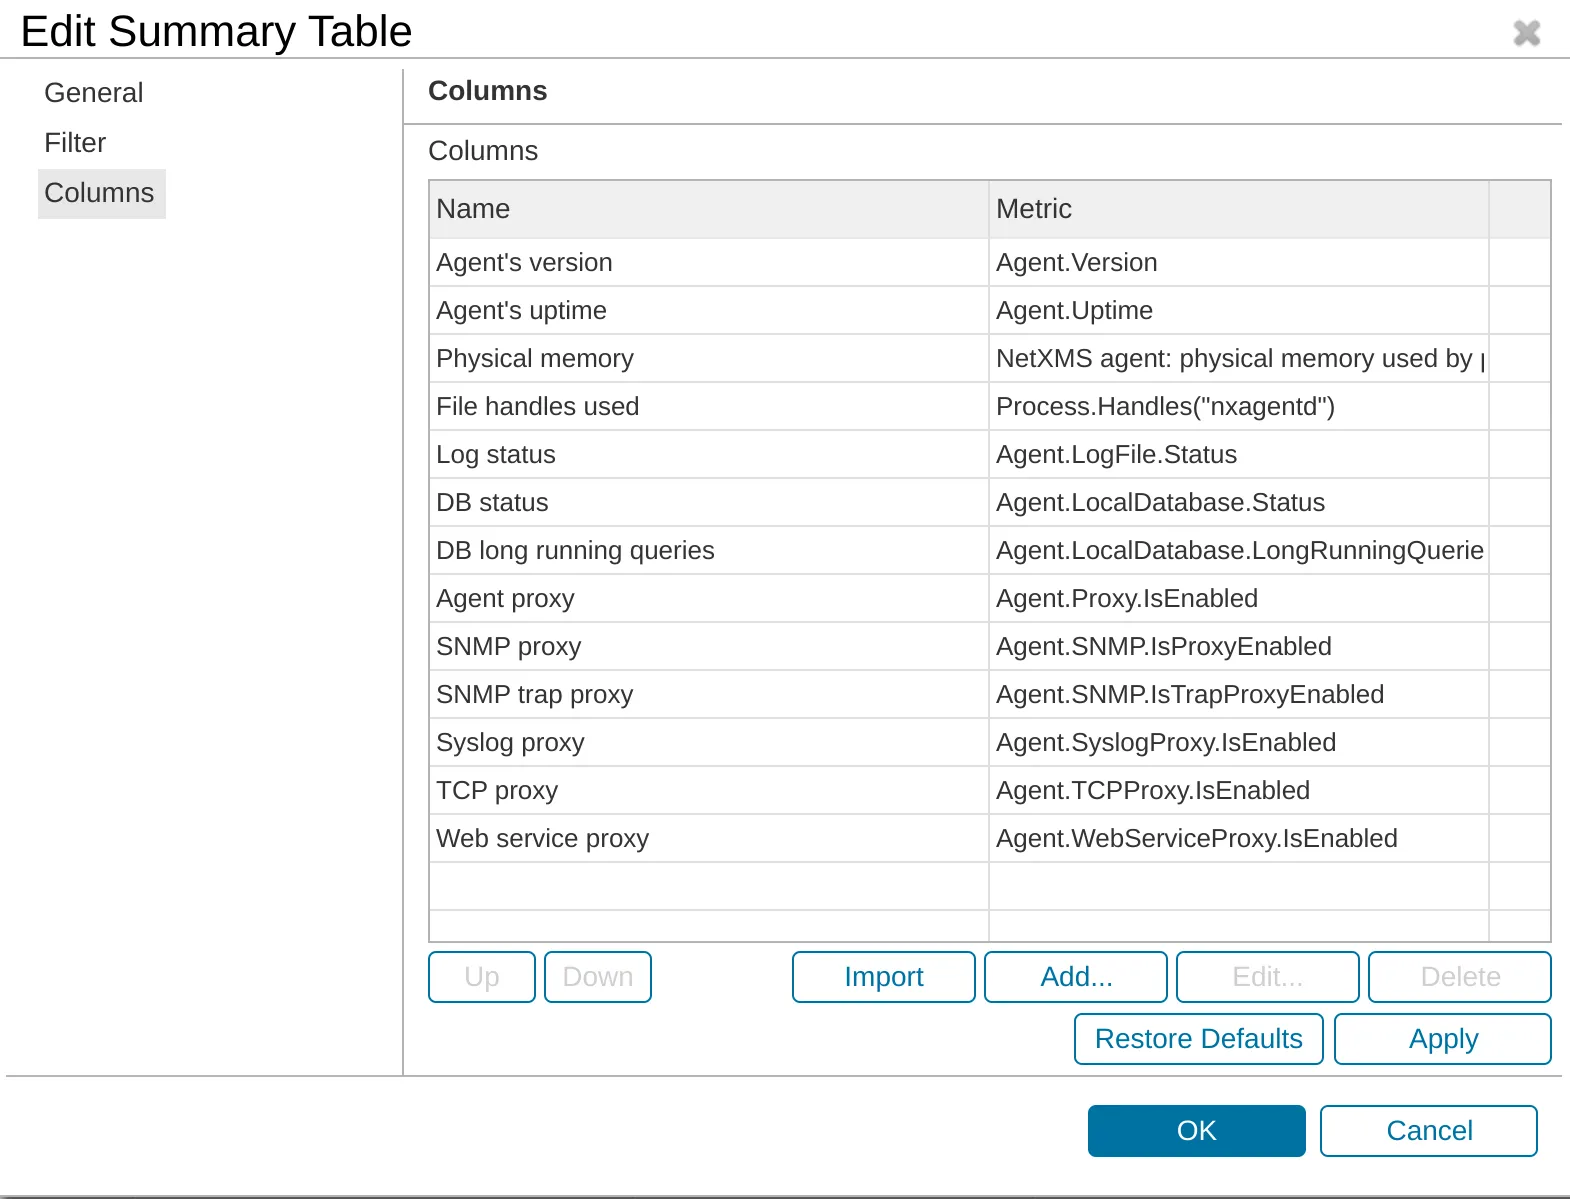
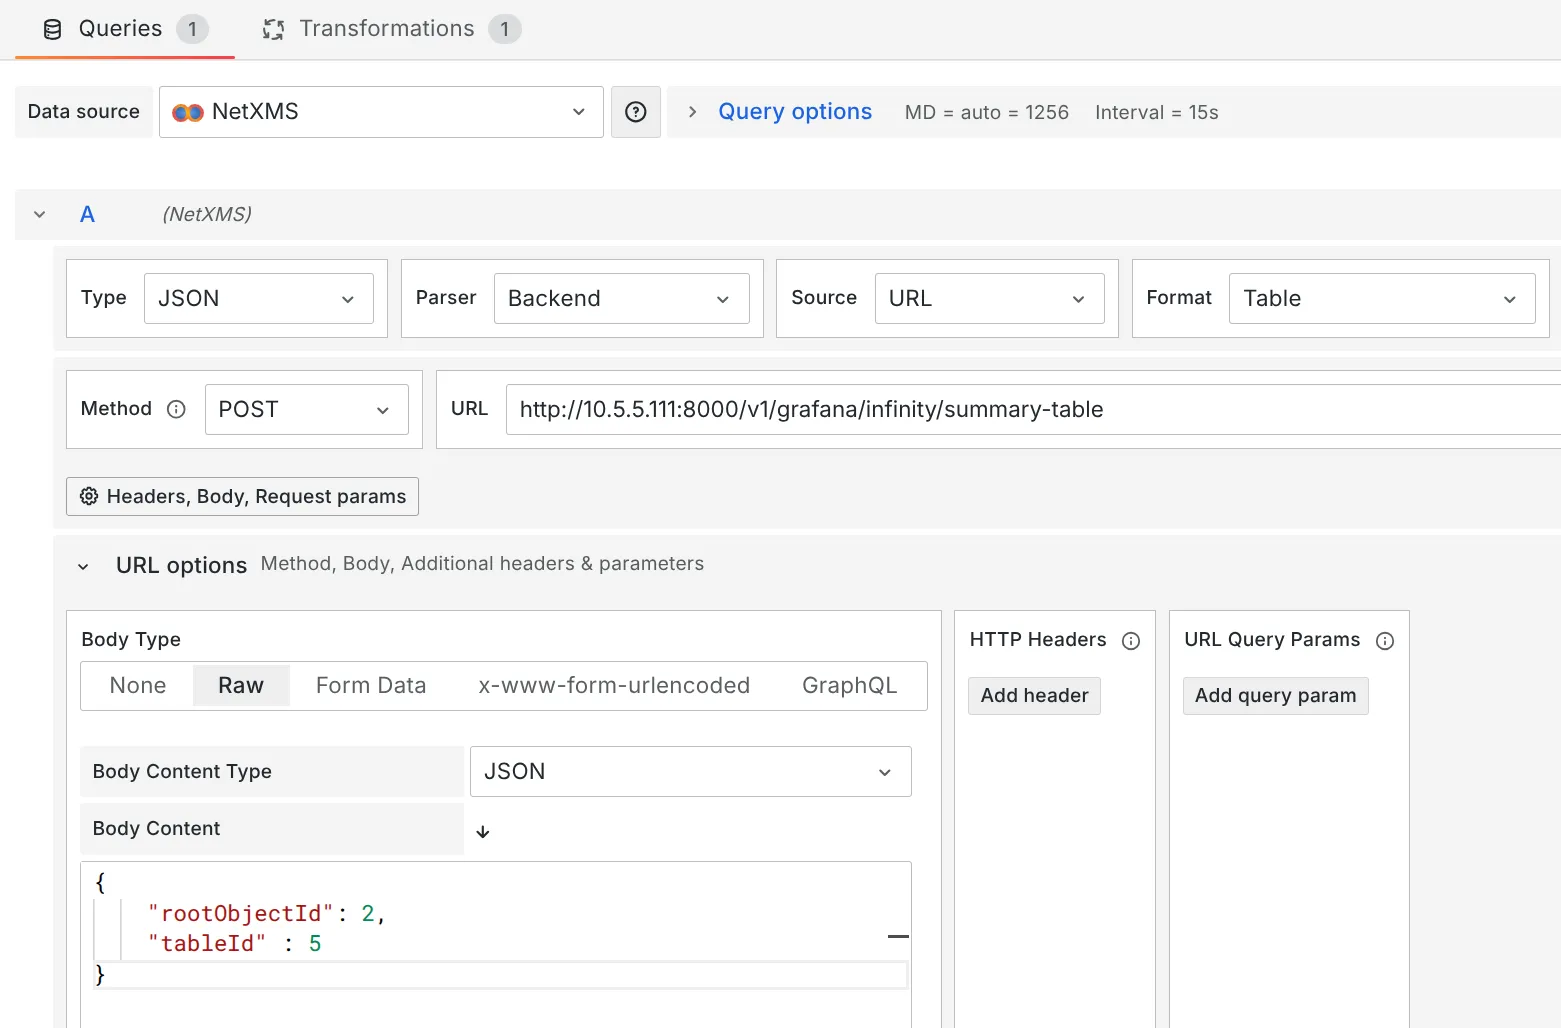
Grafana configuration:
- Method: POST
- URL: http://server_address:server_port/v1/grafana/infinity/summary-table
- Request JSON data:
{ "rootObjectId": 2, "tableId" : 5 }
By default, Grafana sorts columns alphabetically. To arrange them in the same order as it’s shown in NetXMS, we use the “Column Order” data transformation.
Data collection history
This endpoint provides historical DCI data. It can be used to display the data as both a graph and a table. Let’s look at both in this section.
Request info
- Request: GET
- URL: /v1/objects/:object-id/data-collection/:dci-id/history?timeFrom=XXX&timeTo=YYY
The URL should contain the correct object ID, DCI ID, start timestamp, and end timestamp.
The API will return a JSON object containing the description, unit name, and an array of values.
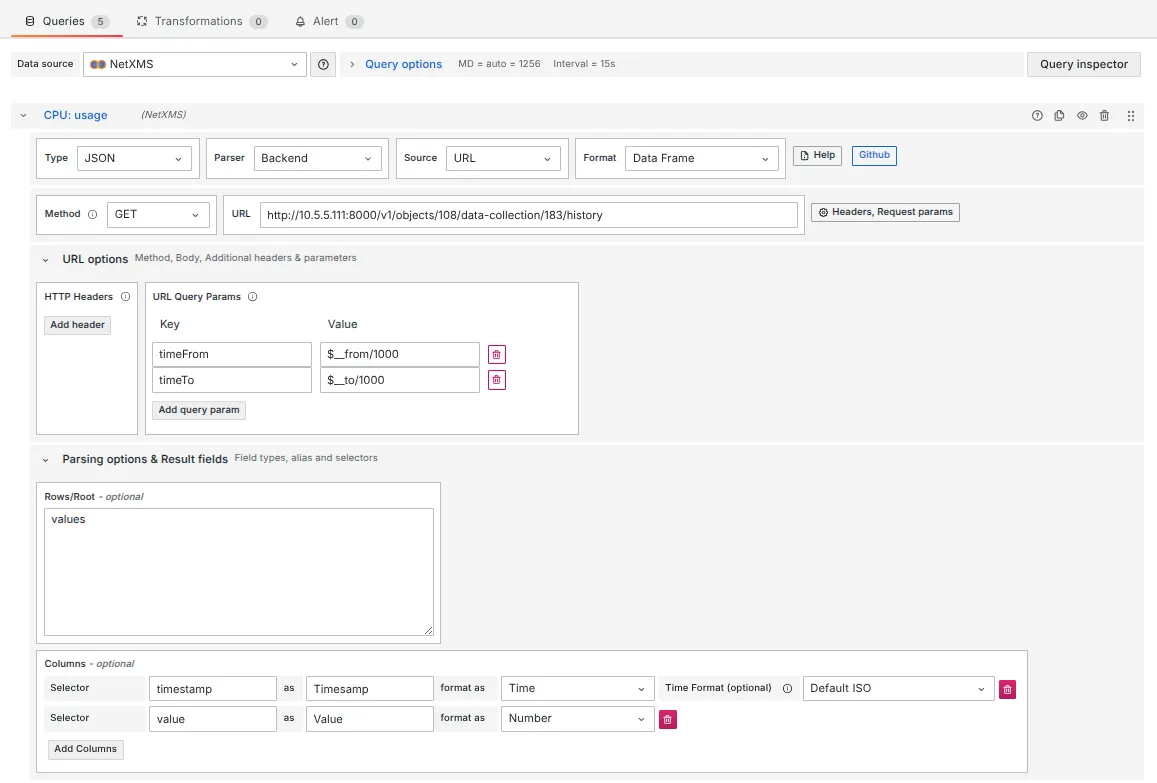
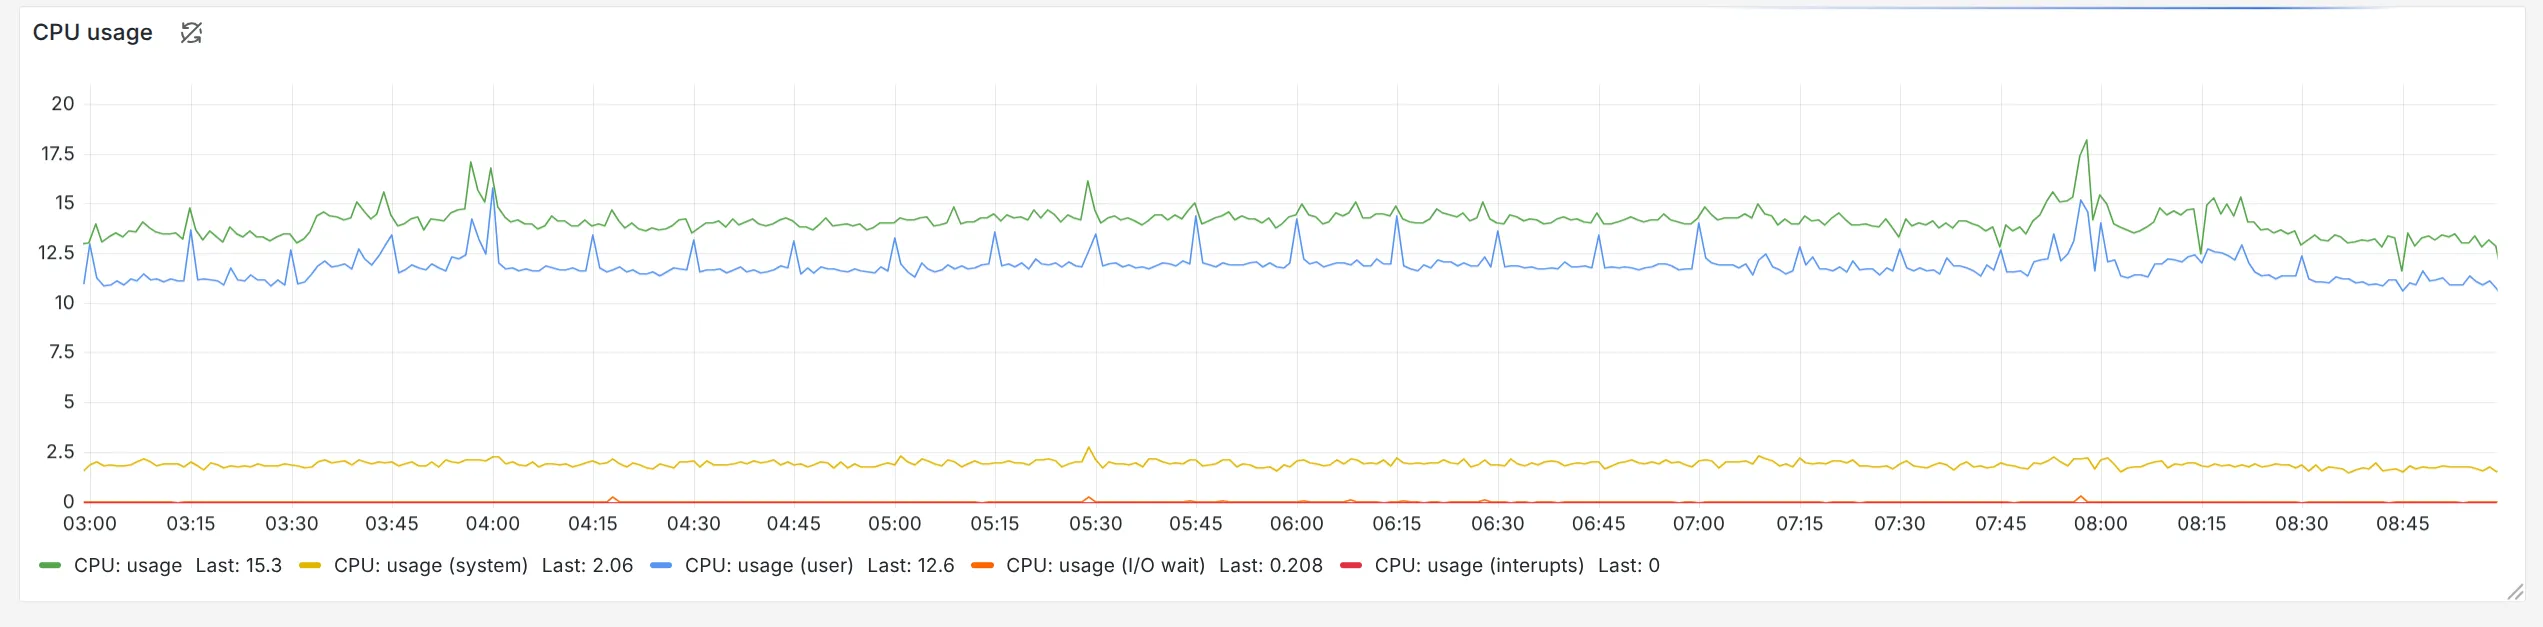
Example: CPU Graph
In this example, we created a line chart showing CPU usage.
Configuration:
We will not go into the DCI configuration here, as it is part of the default NetXMS templates.
Instead, we’ll describe the configuration for one entry; the other entries in the Time Series panel have exactly the same configuration, with only the DCI ID being different.
The time frame for the requested data is taken from the dashboard’s configured time range. We divide it by 1000, as Grafana provides the time in milliseconds, while NetXMS expects it in seconds.
-
Name: CPU Usage
-
Format: Data Frame
-
Method: GET
-
URL: http://server_address:server_port/v1/objects/108/data-collection/183/history
-
URL Query Parameters:
- timeFrom = $__from/1000
- timeTo = $__to/1000
-
Root: values
-
Columns:
- timestamp as Timestamp, format as Time, time format Default ISO
- value as Value, format as Number
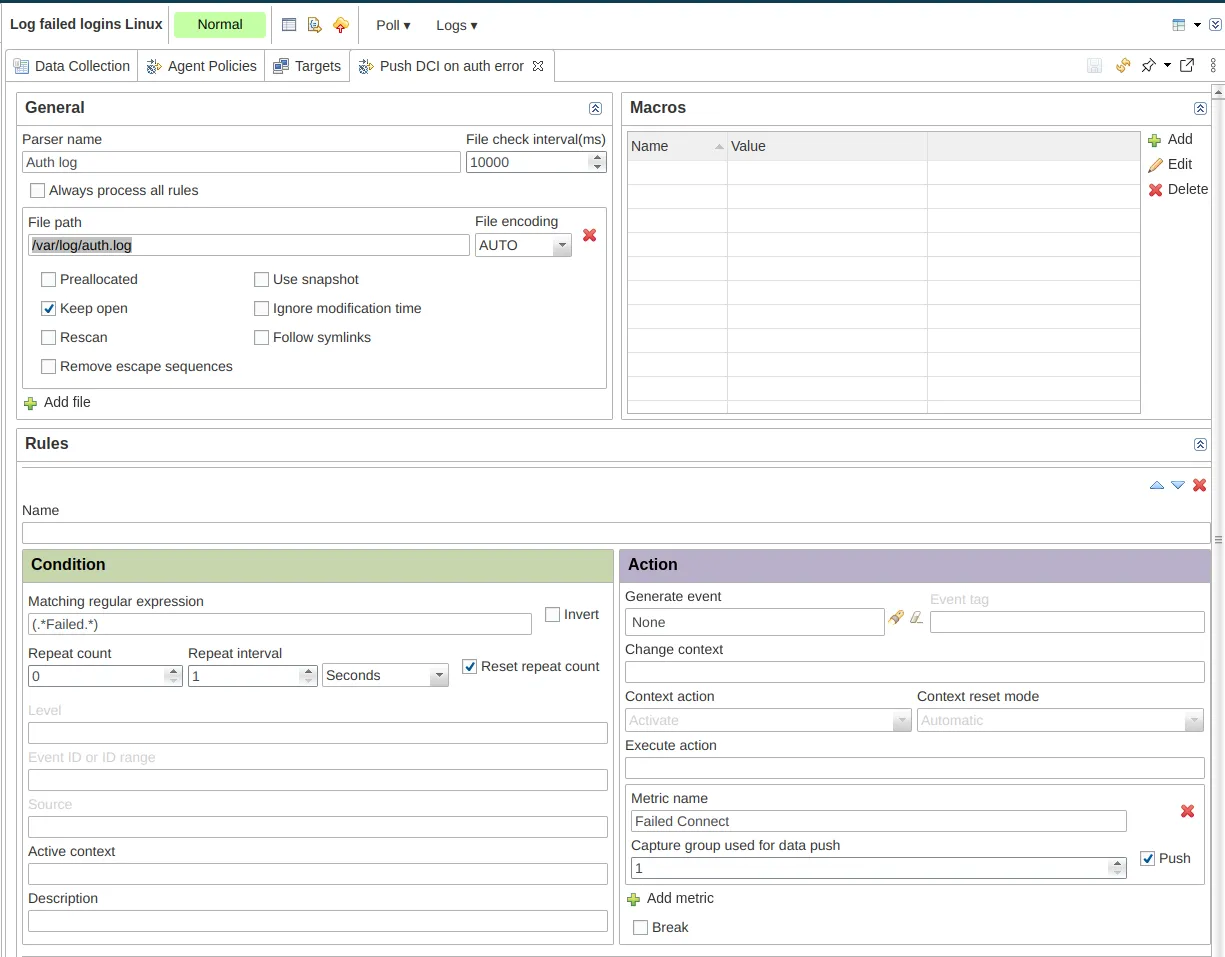
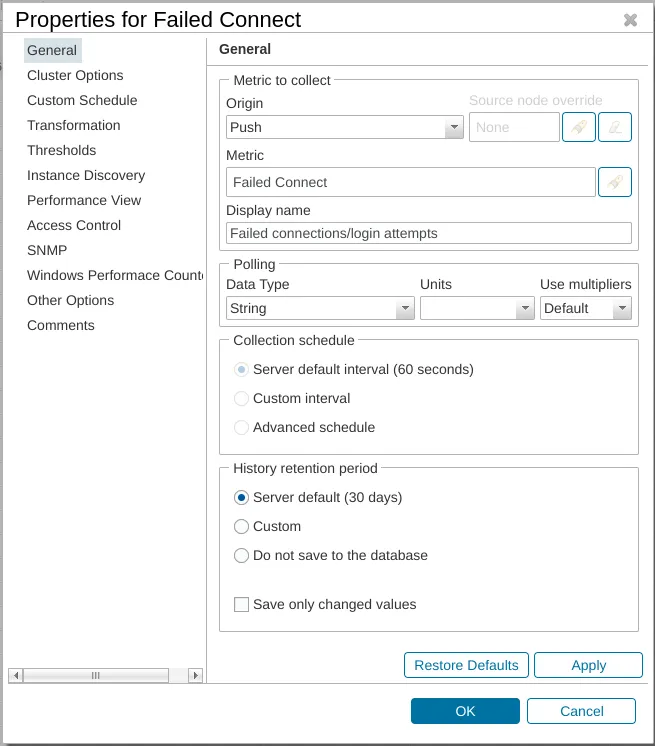
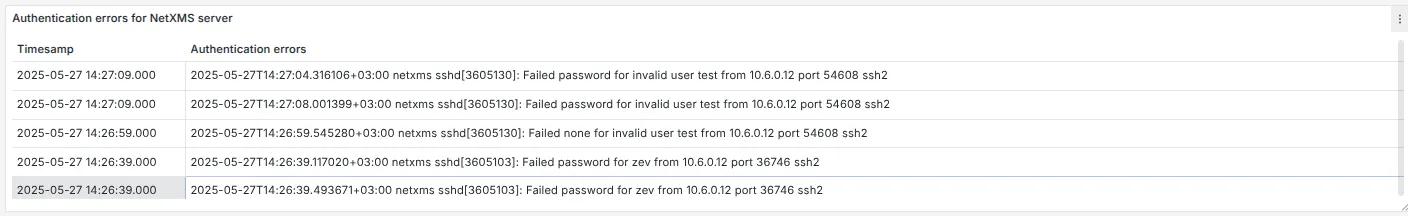
Example of the authentication error history
NetXMS Configuration:
In NetXMS, we’ve created a template with two policies:
- The first enables the LogWatch subagent.
- The second monitors /var/log/auth.log using the LogWatch subagent and pushes matching lines to a push DCI.
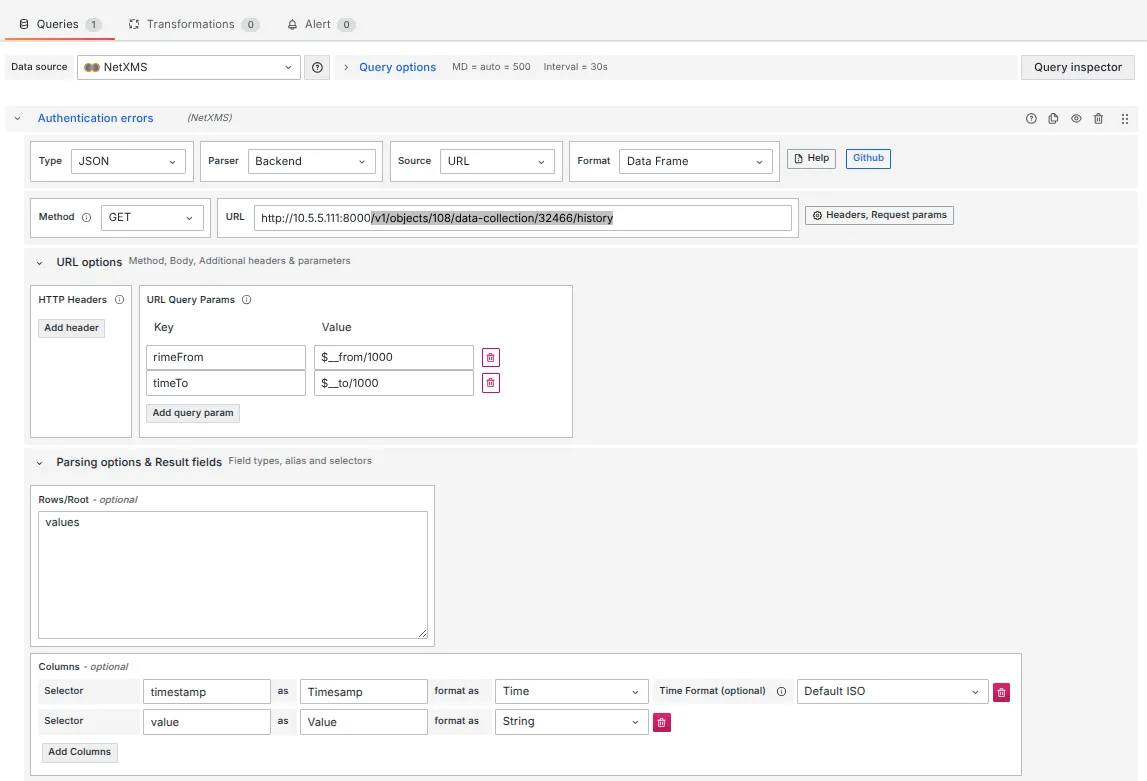
Grafana configuration will require the following steps:
-
Format: Data Frame
-
Method: GET
-
URL: http://server_address:server_port/v1/objects/108/data-collection/32466/history
-
URL Query Parameters:
- timeFrom = $__from/1000
- timeTo = $__to/1000
-
Root: values
-
Columns:
- timestamp as Timestamp, format as Time, time format Default ISO
- value as Value, format as Number
And it’s done — the use of Grafana within NetXMS is now enabled, and configuration is complete. Let us know how it went or if you have any further questions in the NetXMS forum!