
Previously, NetXMS users could only create constant dashboards with predefined connections to specific nodes and data collection items (DCIs). This year, following our users’ numerous requests, we introduced context dashboards. Now anyone using NetXMS can create templates that dynamically populate dashboard elements based on the current context, such as the selected node.
Creating a Context Dashboard
Creating a context dashboard in NetXMS is easy:
-
Create a new dashboard.
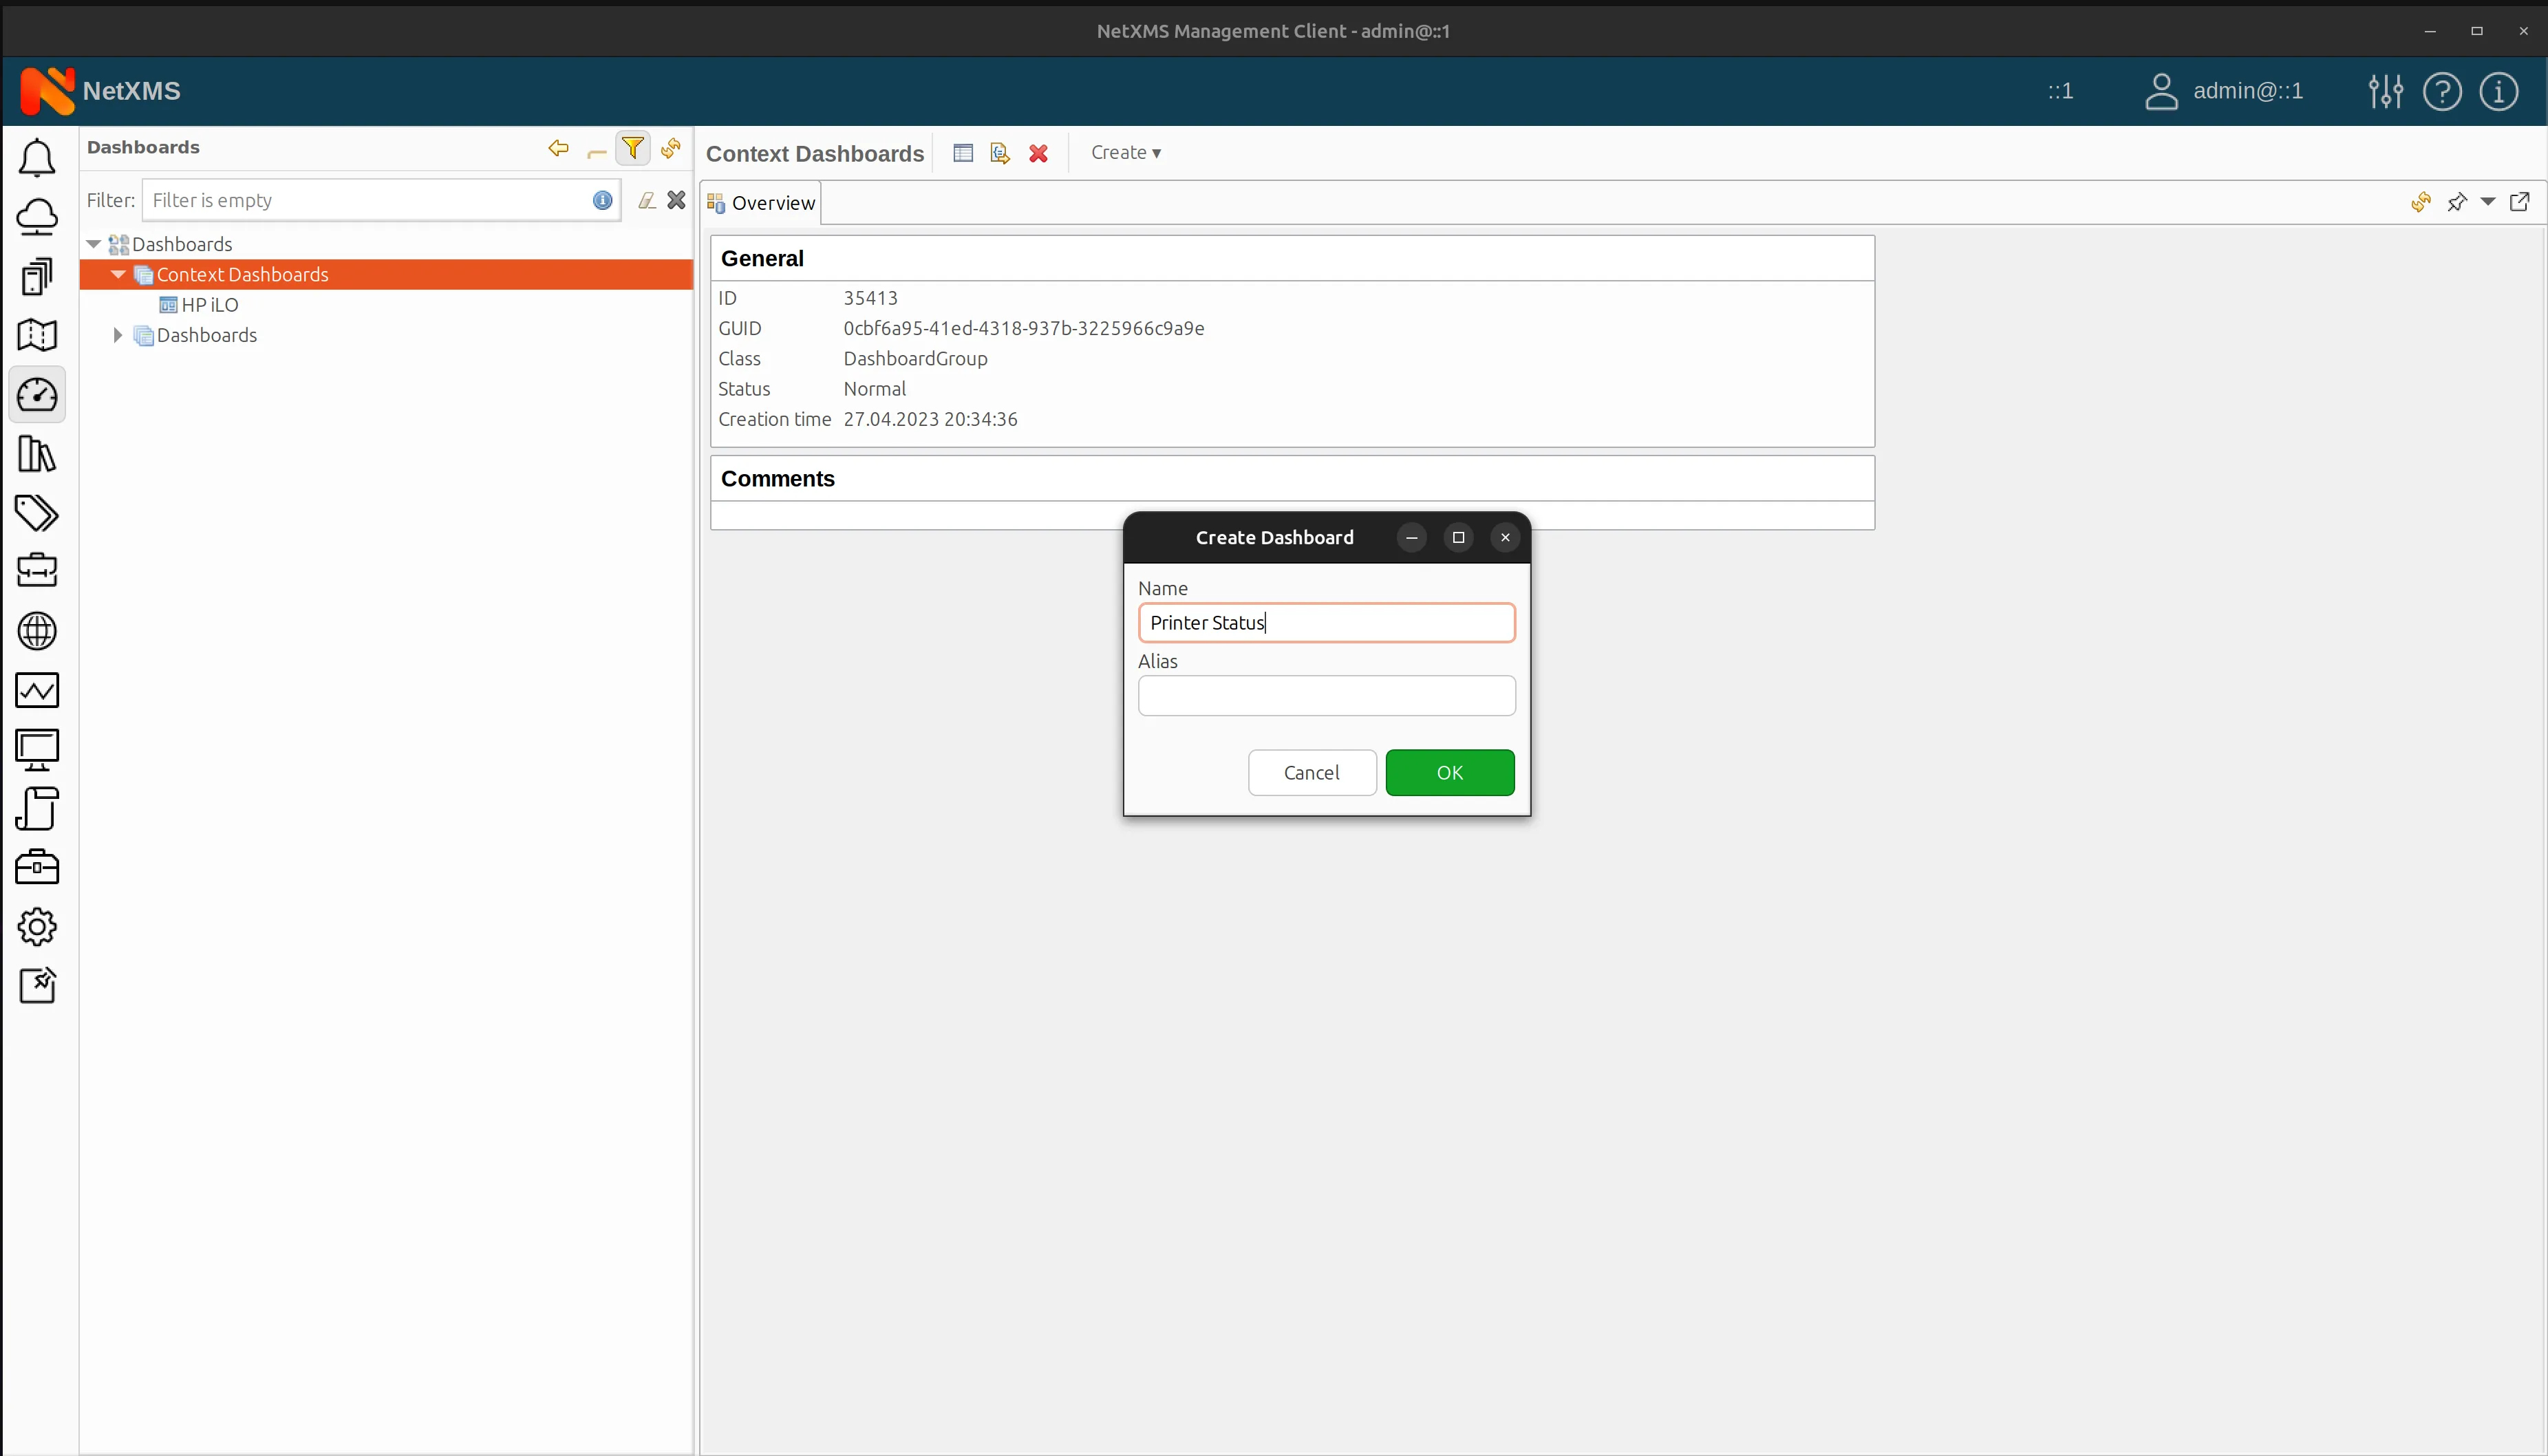
Create dashboard printer status -
Add dashboard elements, such as line charts, gauges, or text elements.
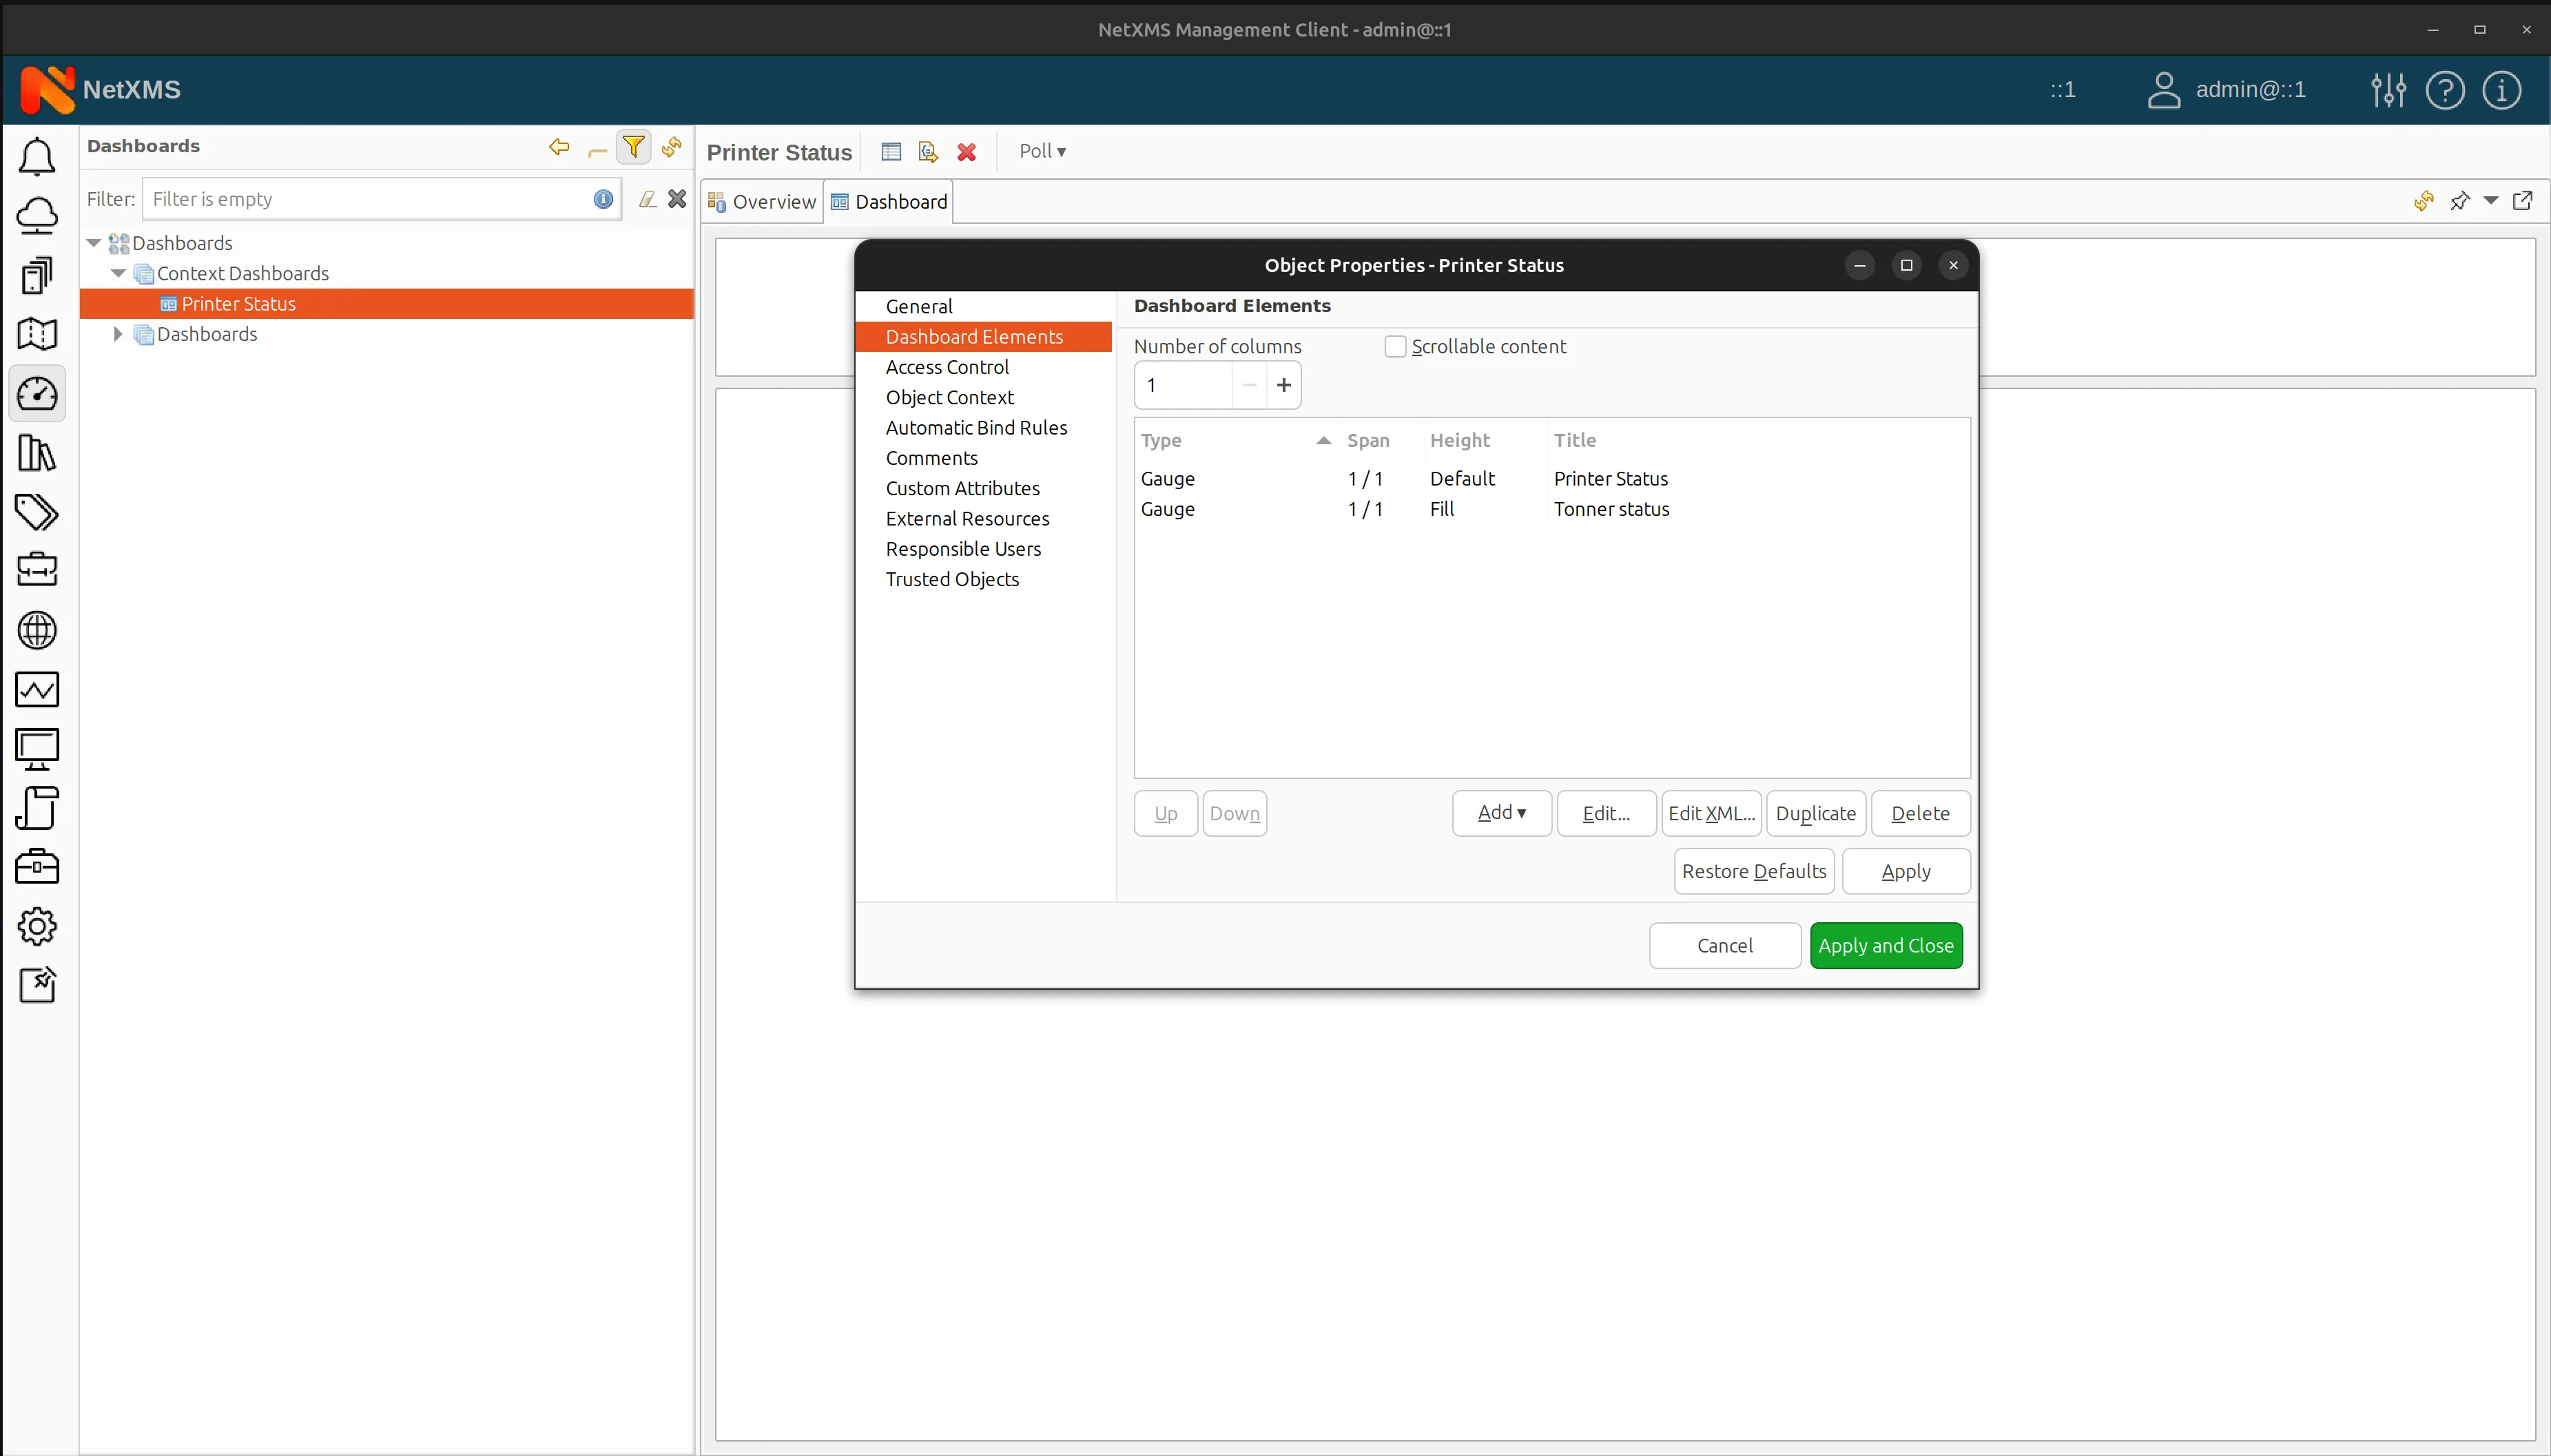
Dashboard elements -
Configure the data sources for each element to use templates instead of exact DCIs.
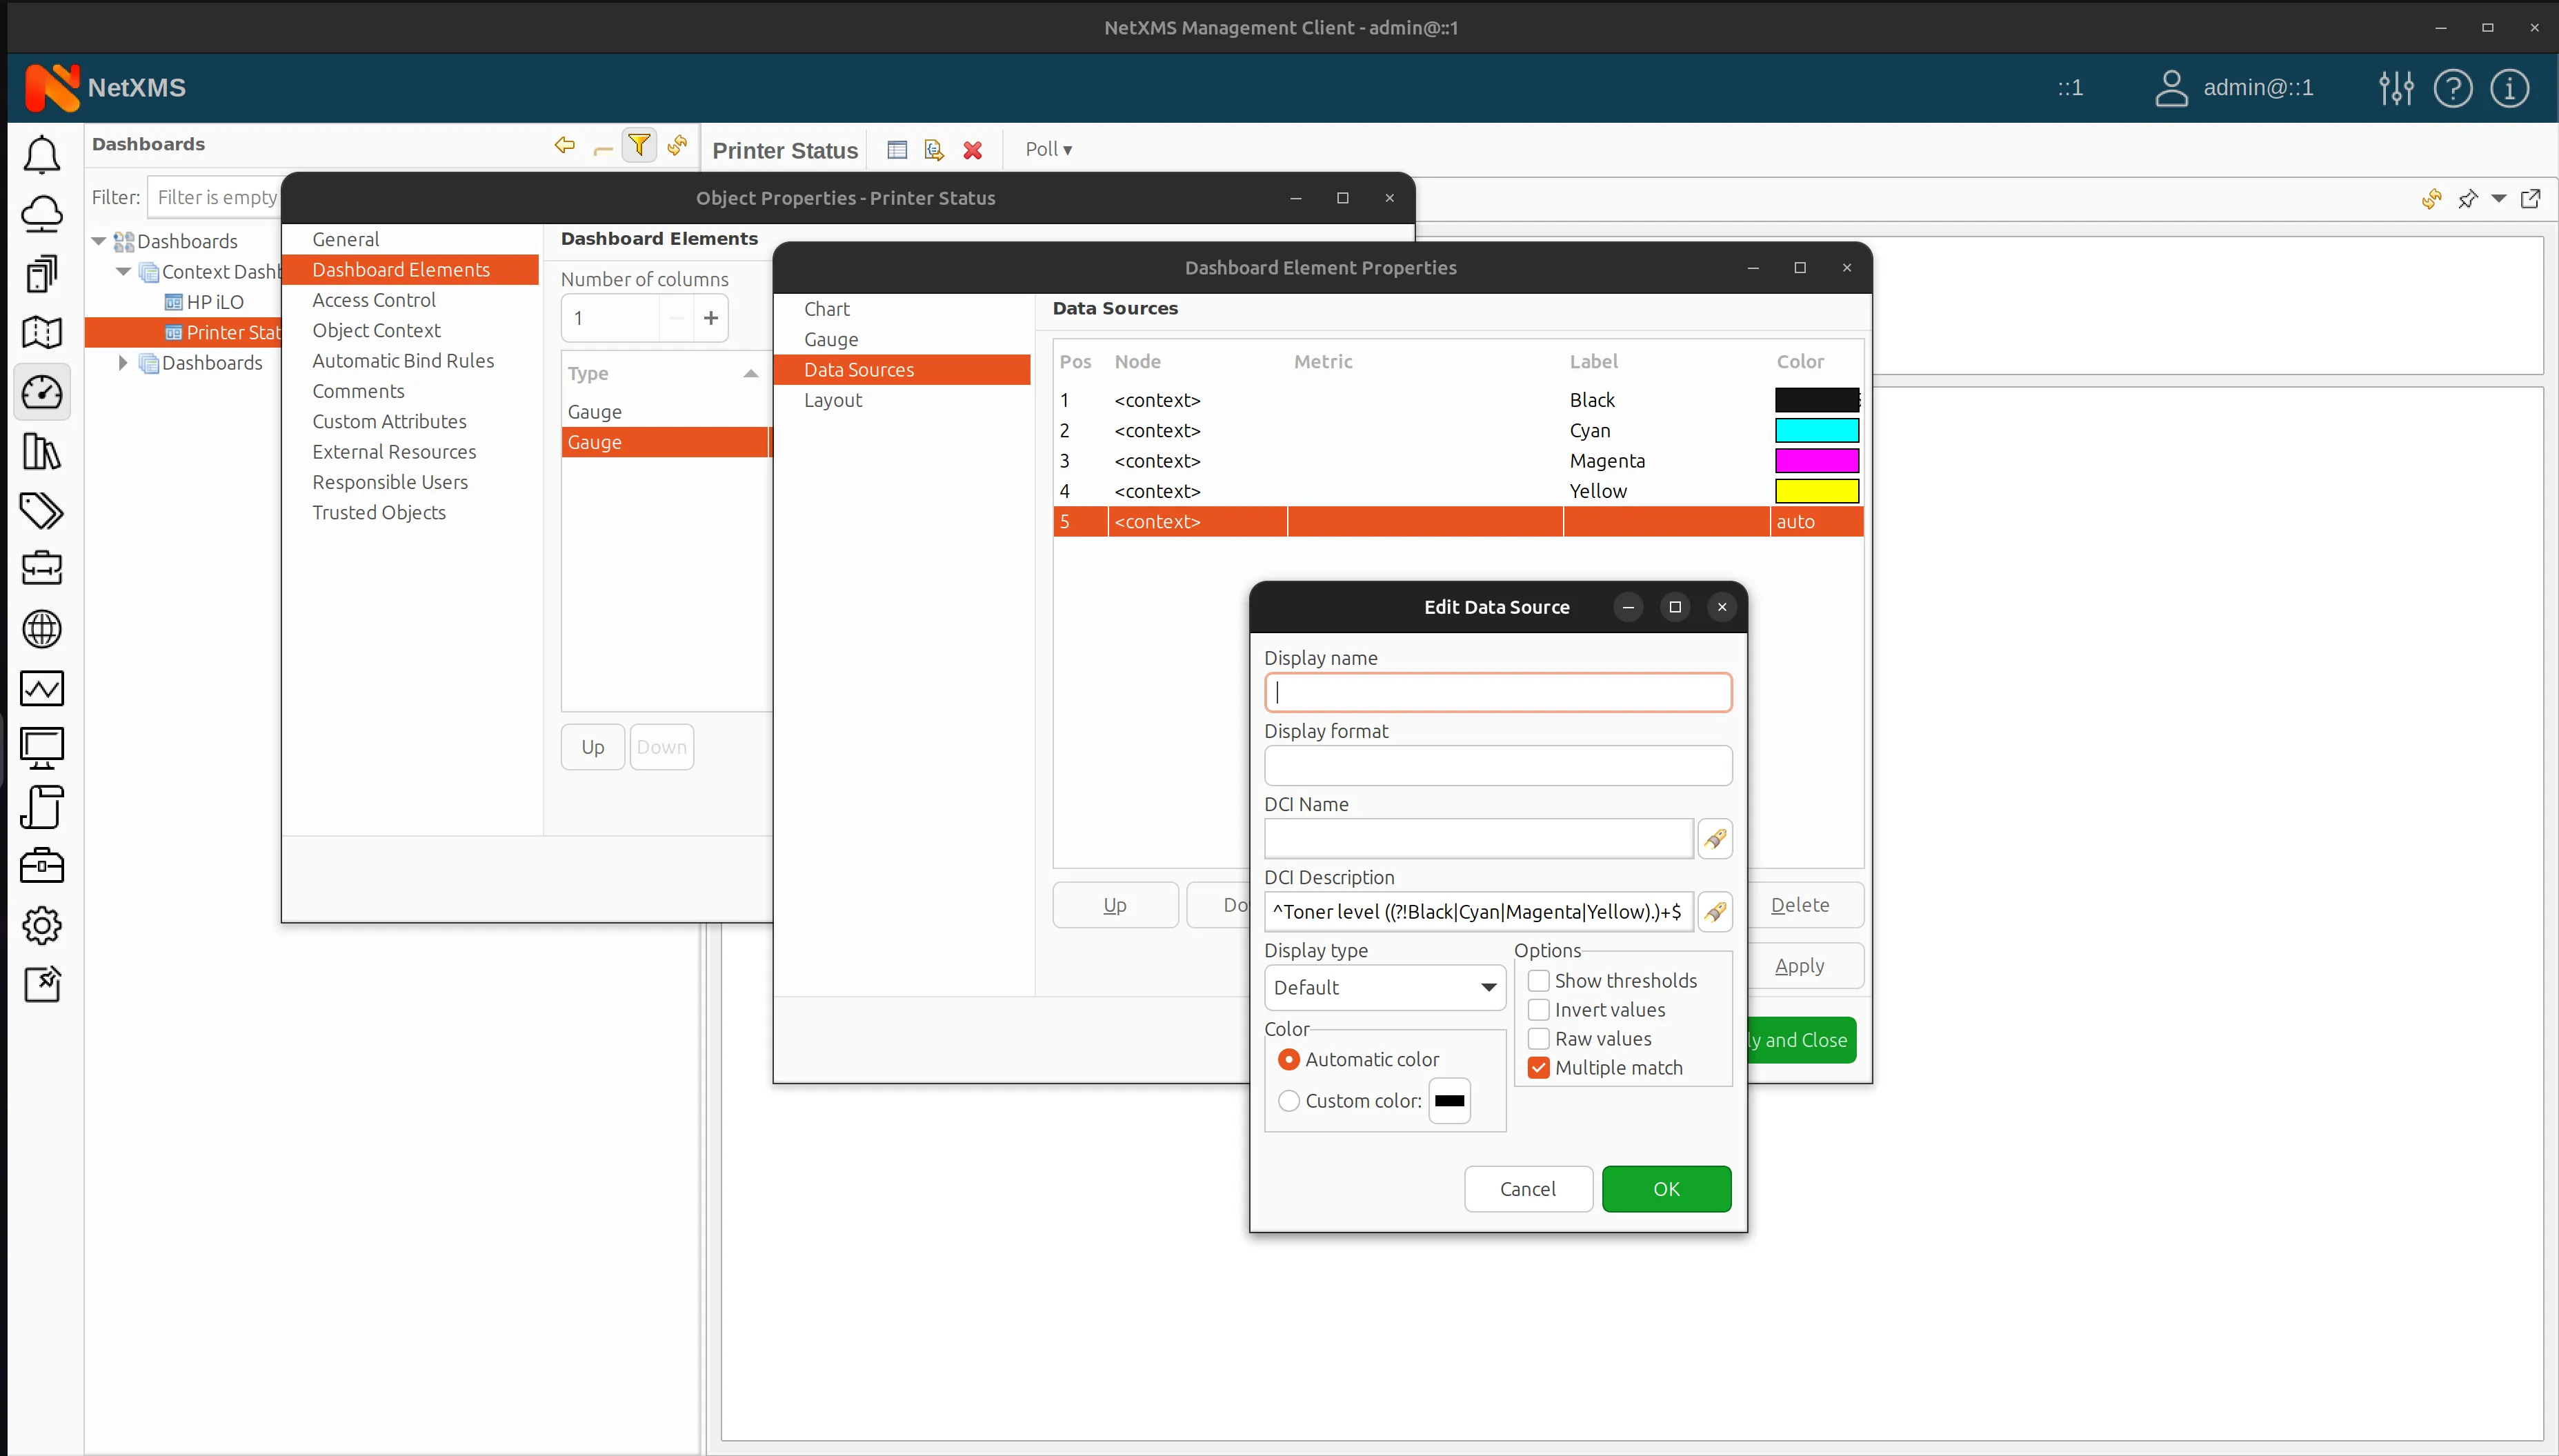
Data source configuration for printer status dashboard -
Specify DCI name or DCI description and the display name, and display format (if needed) for each data source.
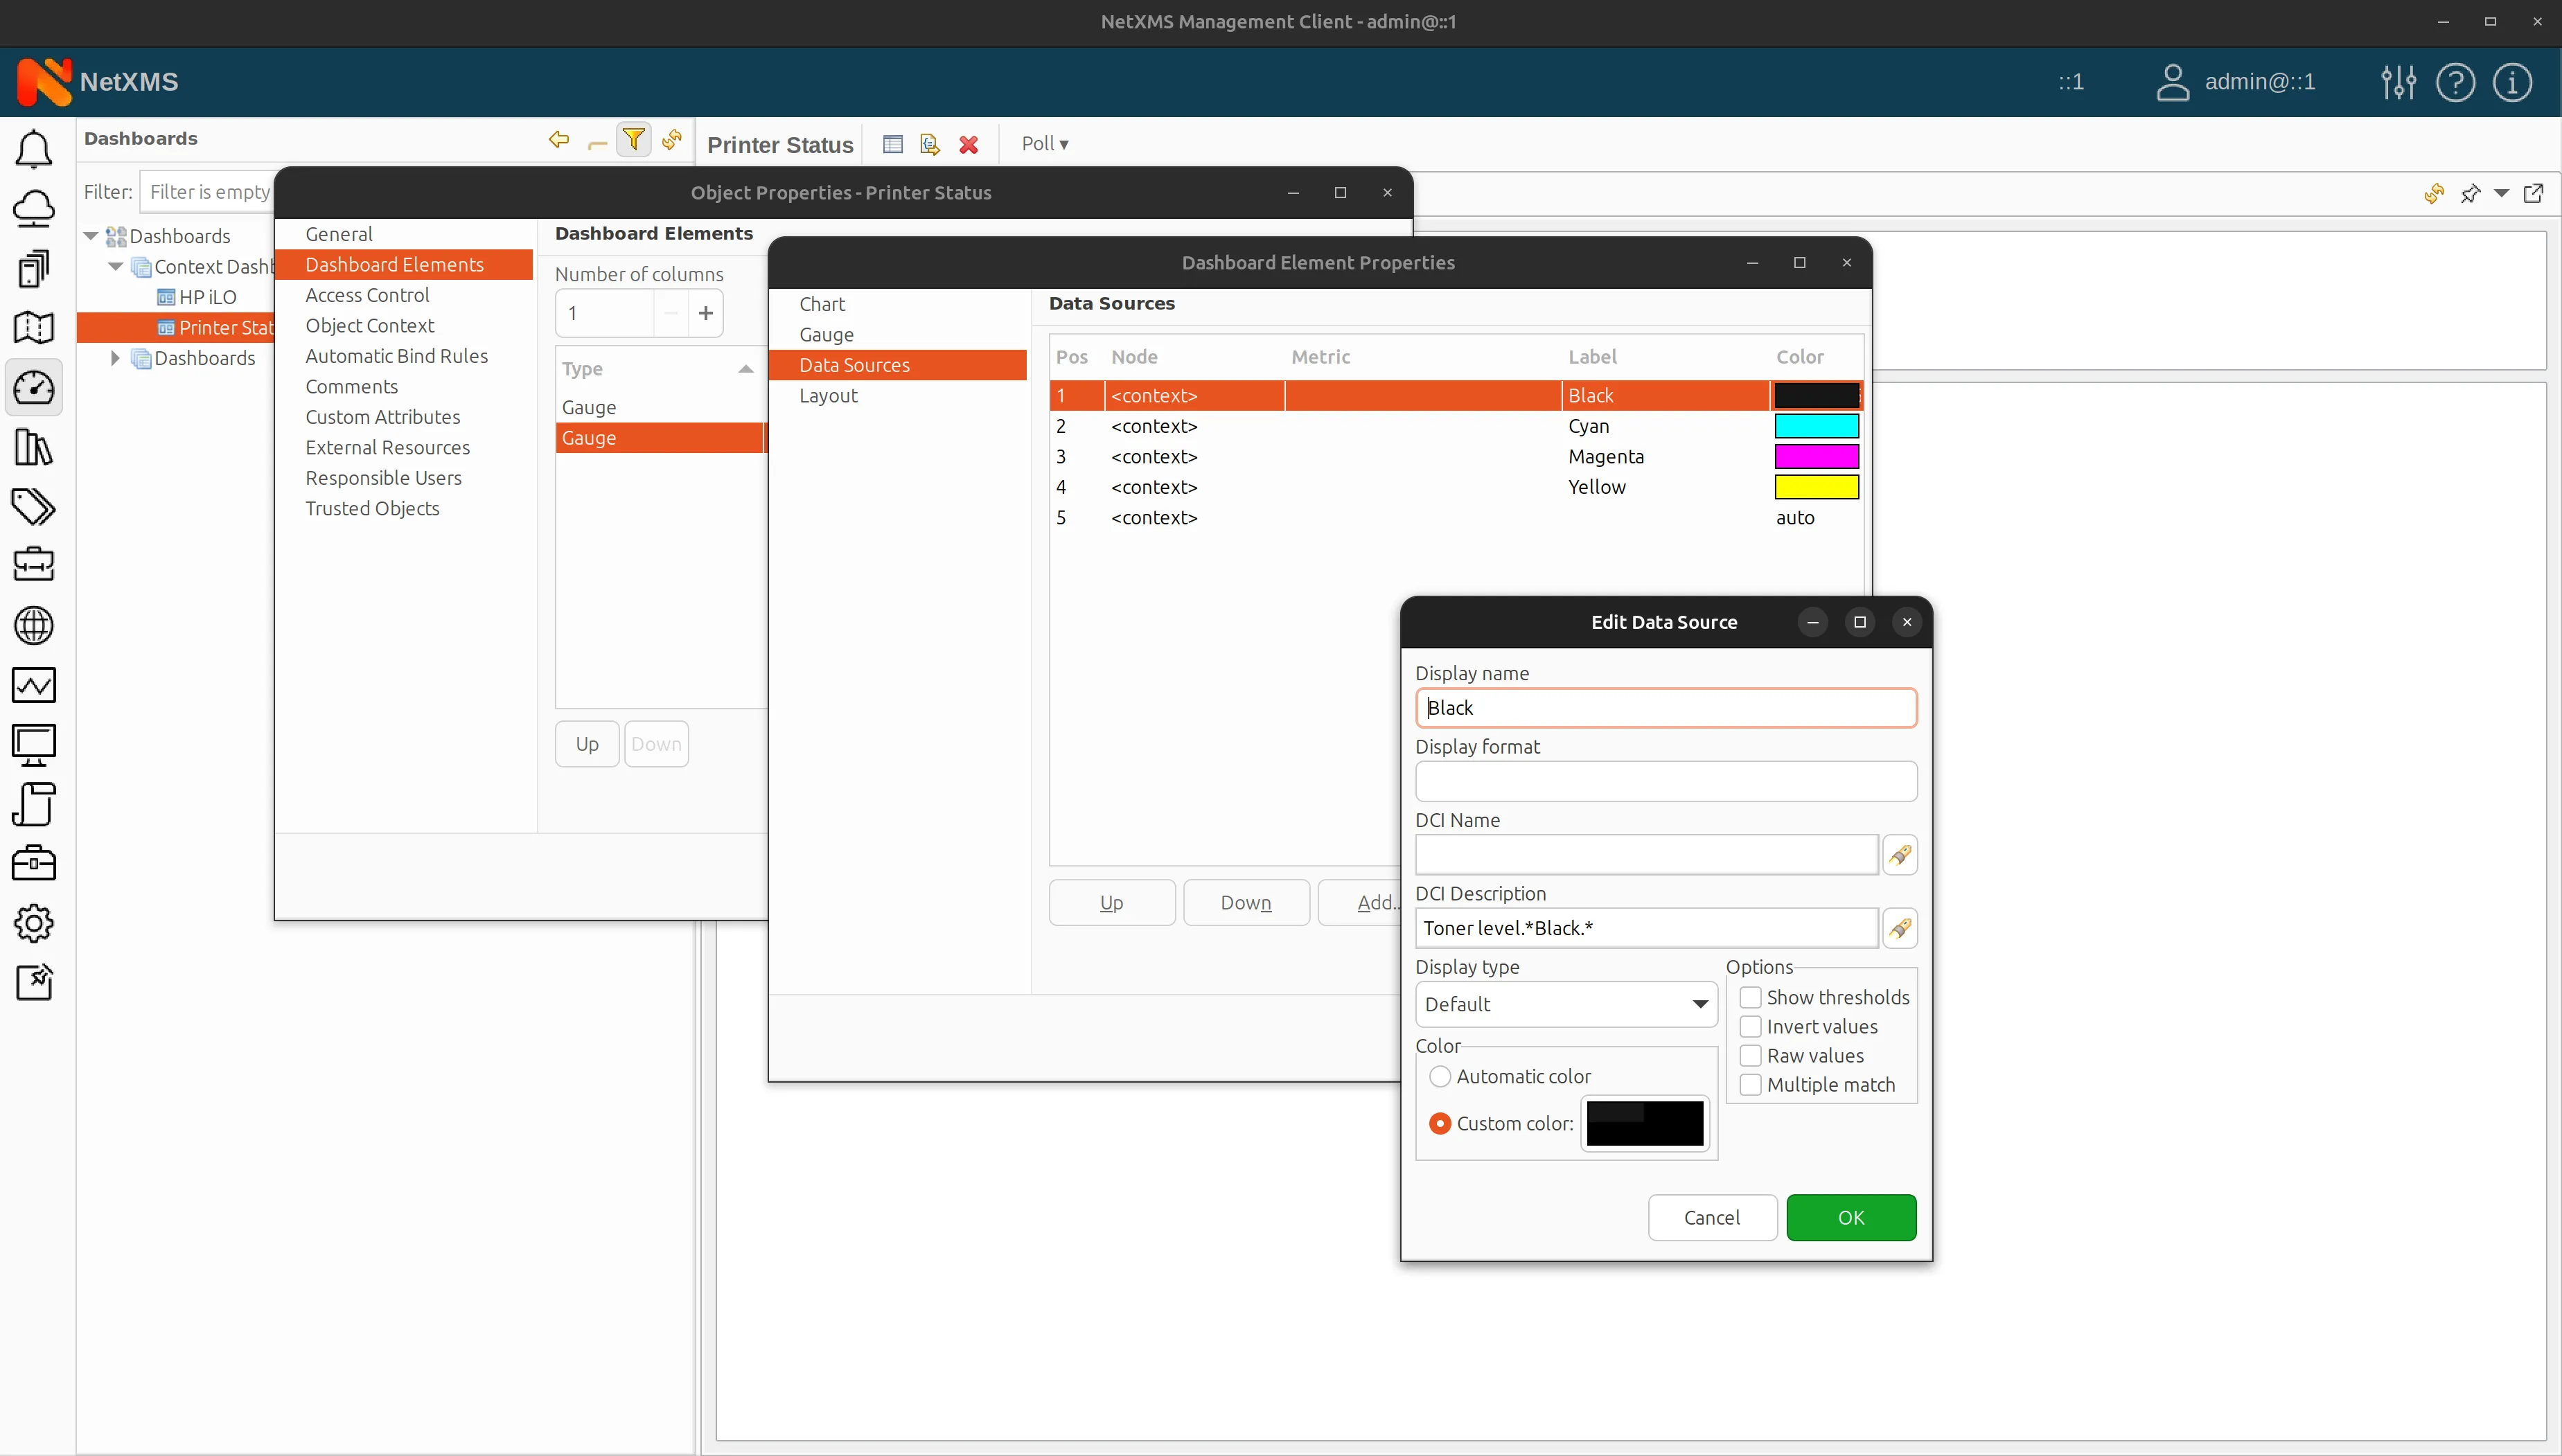
Configure data source printer status example 2
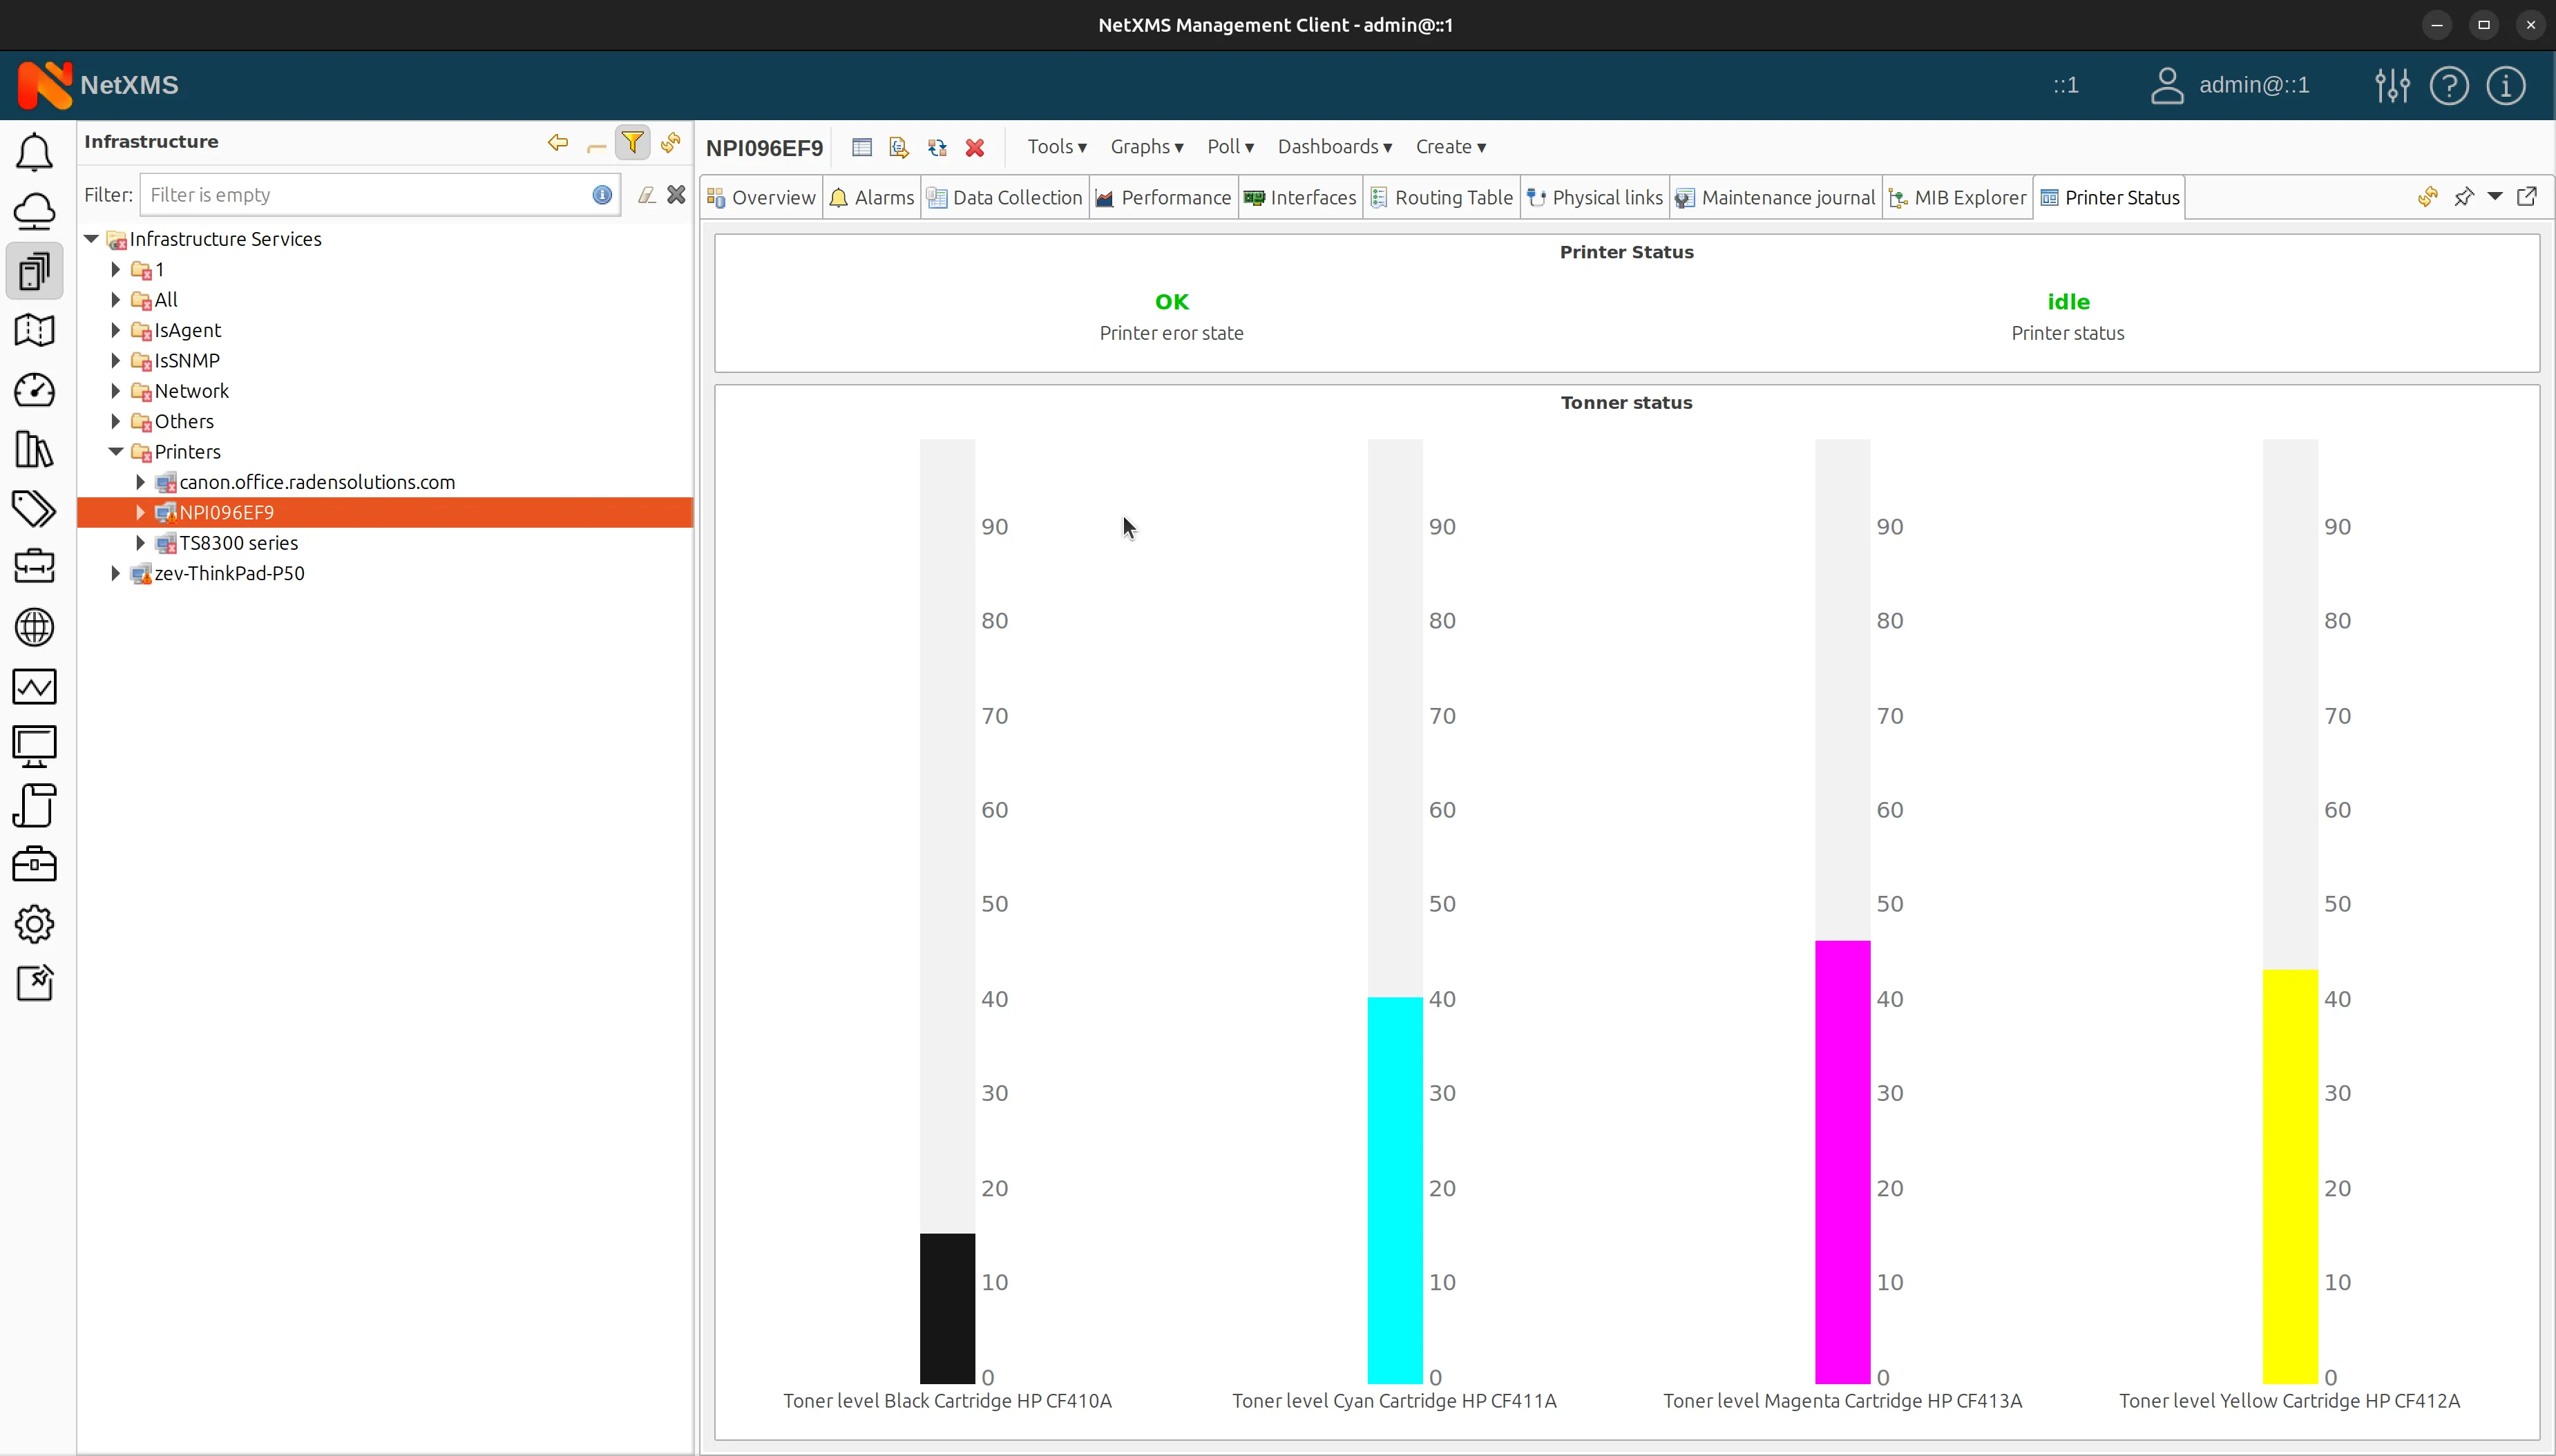
Just like that, you don’t have to re-create a dashboard layout that you find especially useful any more. Now you can apply this dashboard to any specific context and data source.
Context Dashboard Features
Context dashboards in NetXMS provide several useful features:
-
Auto-apply rules — similar to template auto-apply rules, context dashboards can use auto-bind rules to connect dashboards with specific nodes based on certain criteria.
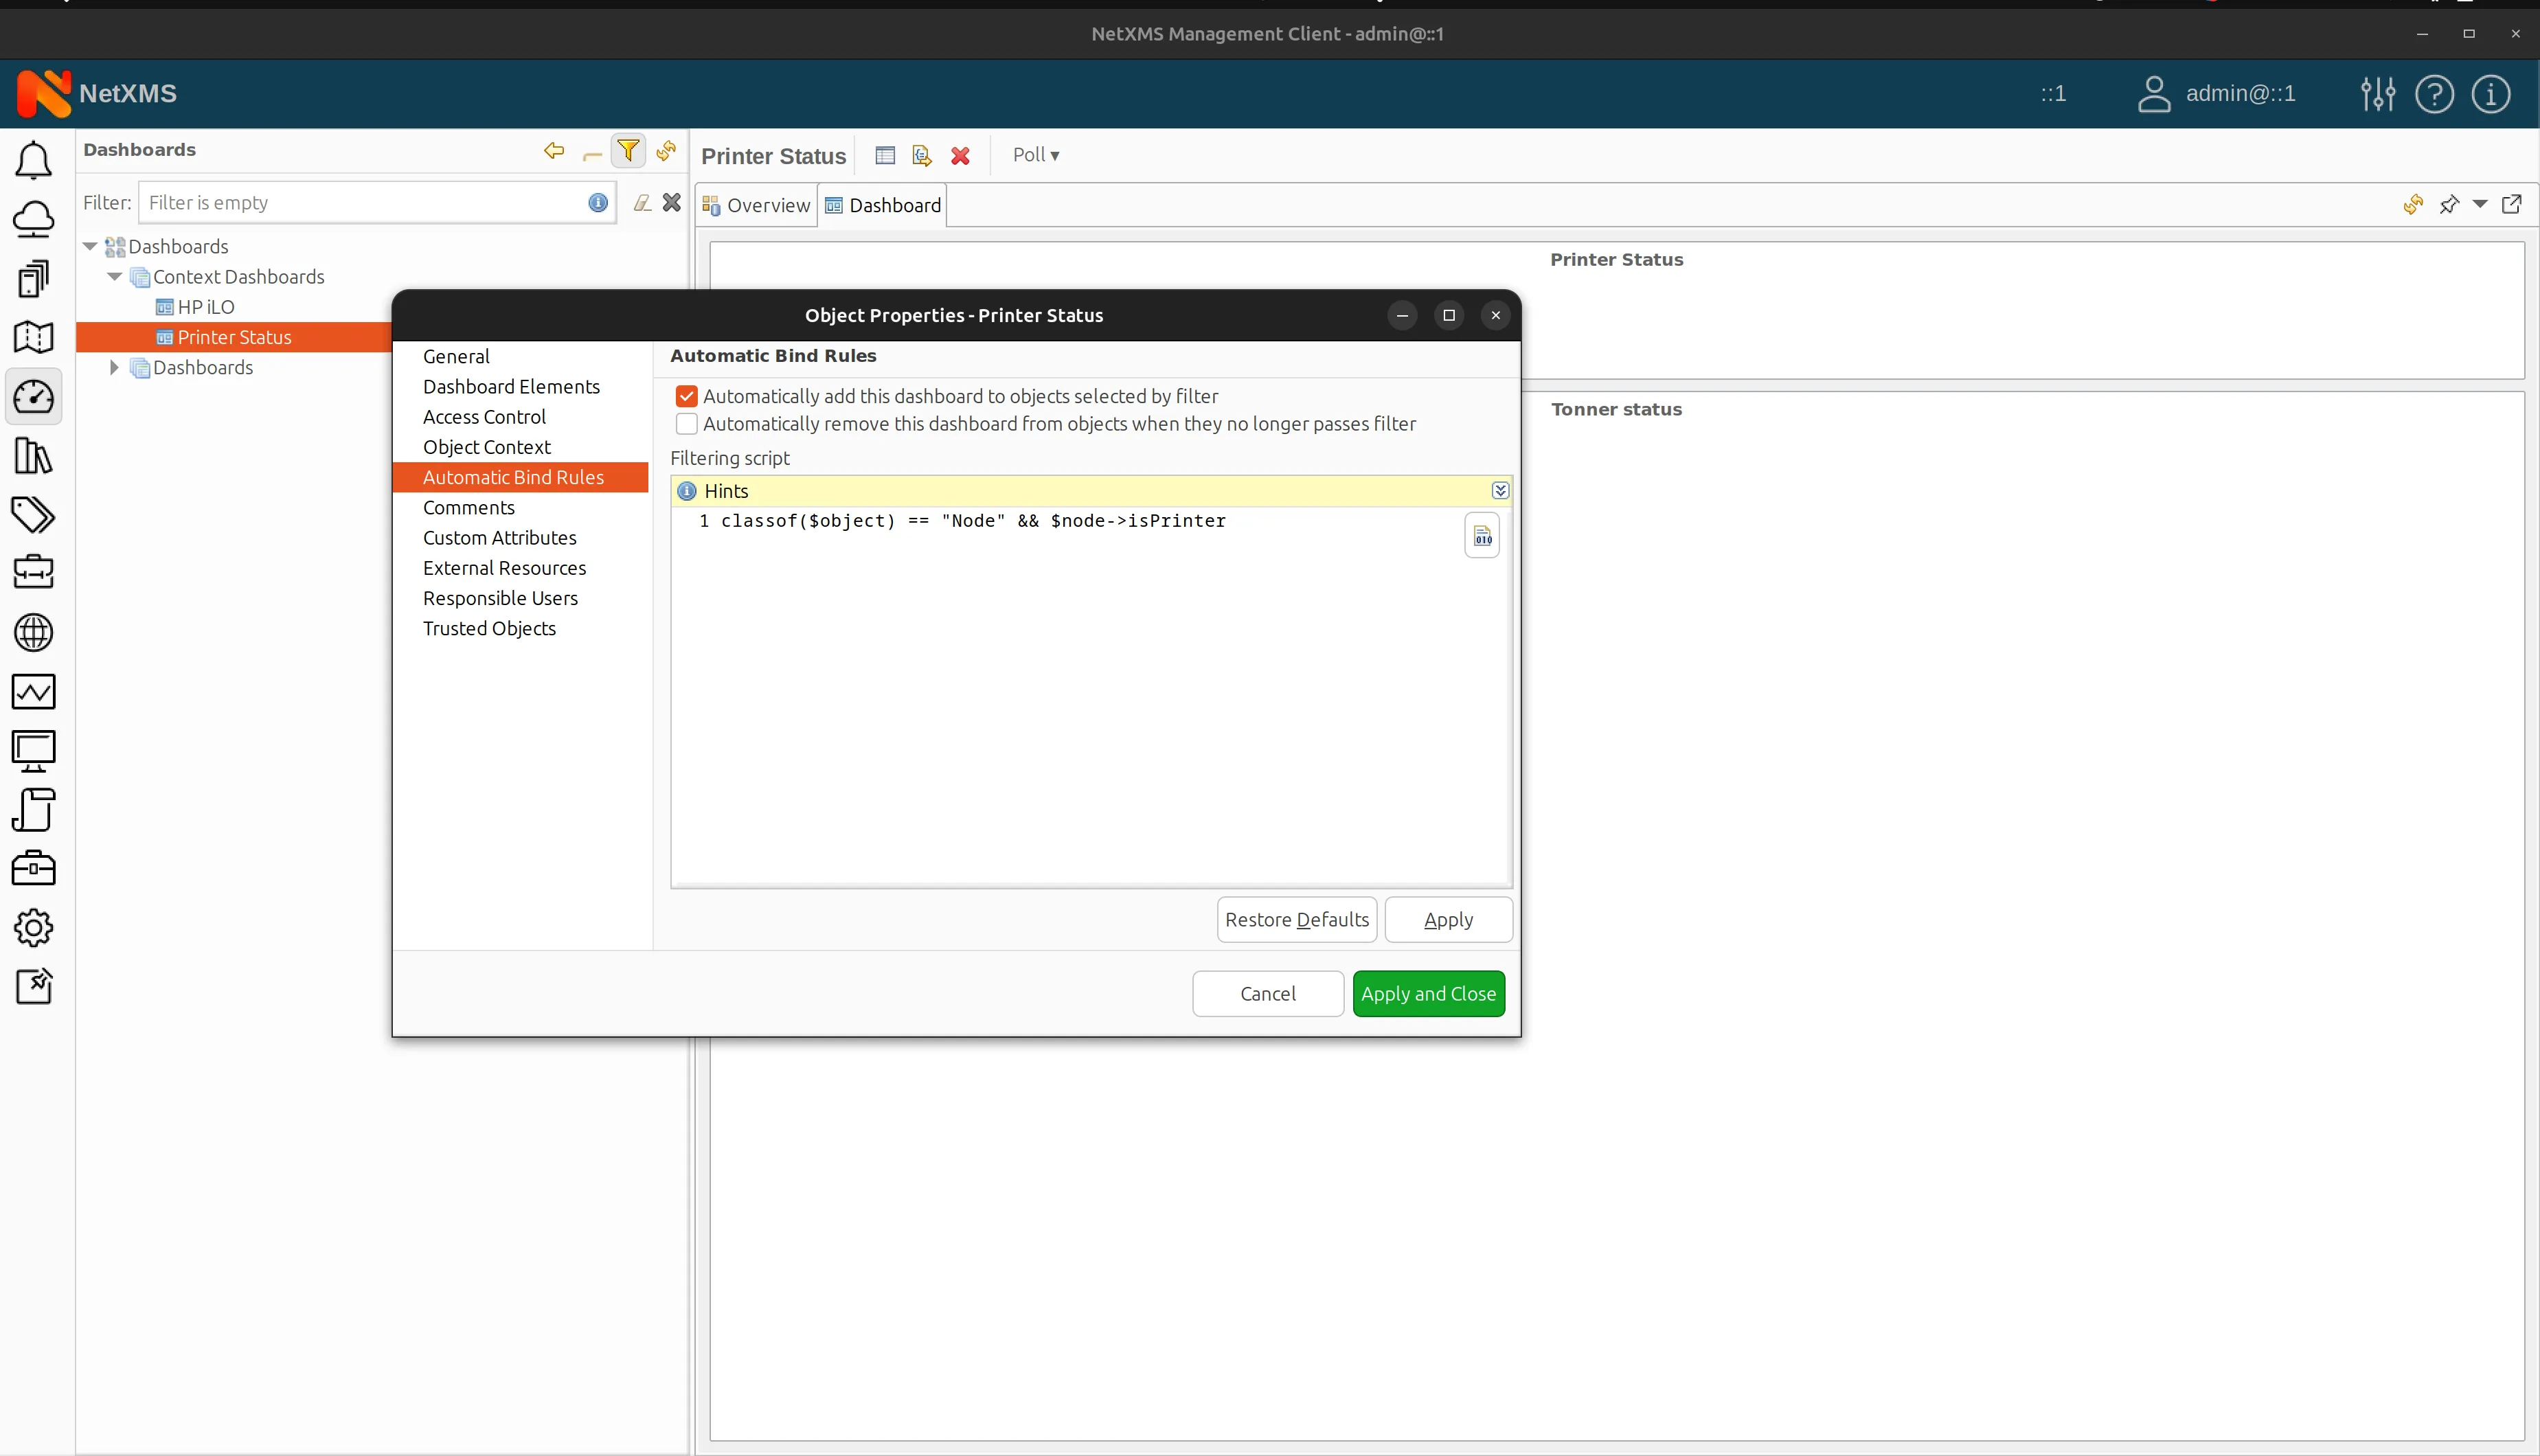
Printer status context dashboard auto apply rules -
Object context configuration — it allows users to control the visibility of context dashboards alongside other tabs in the user interface.
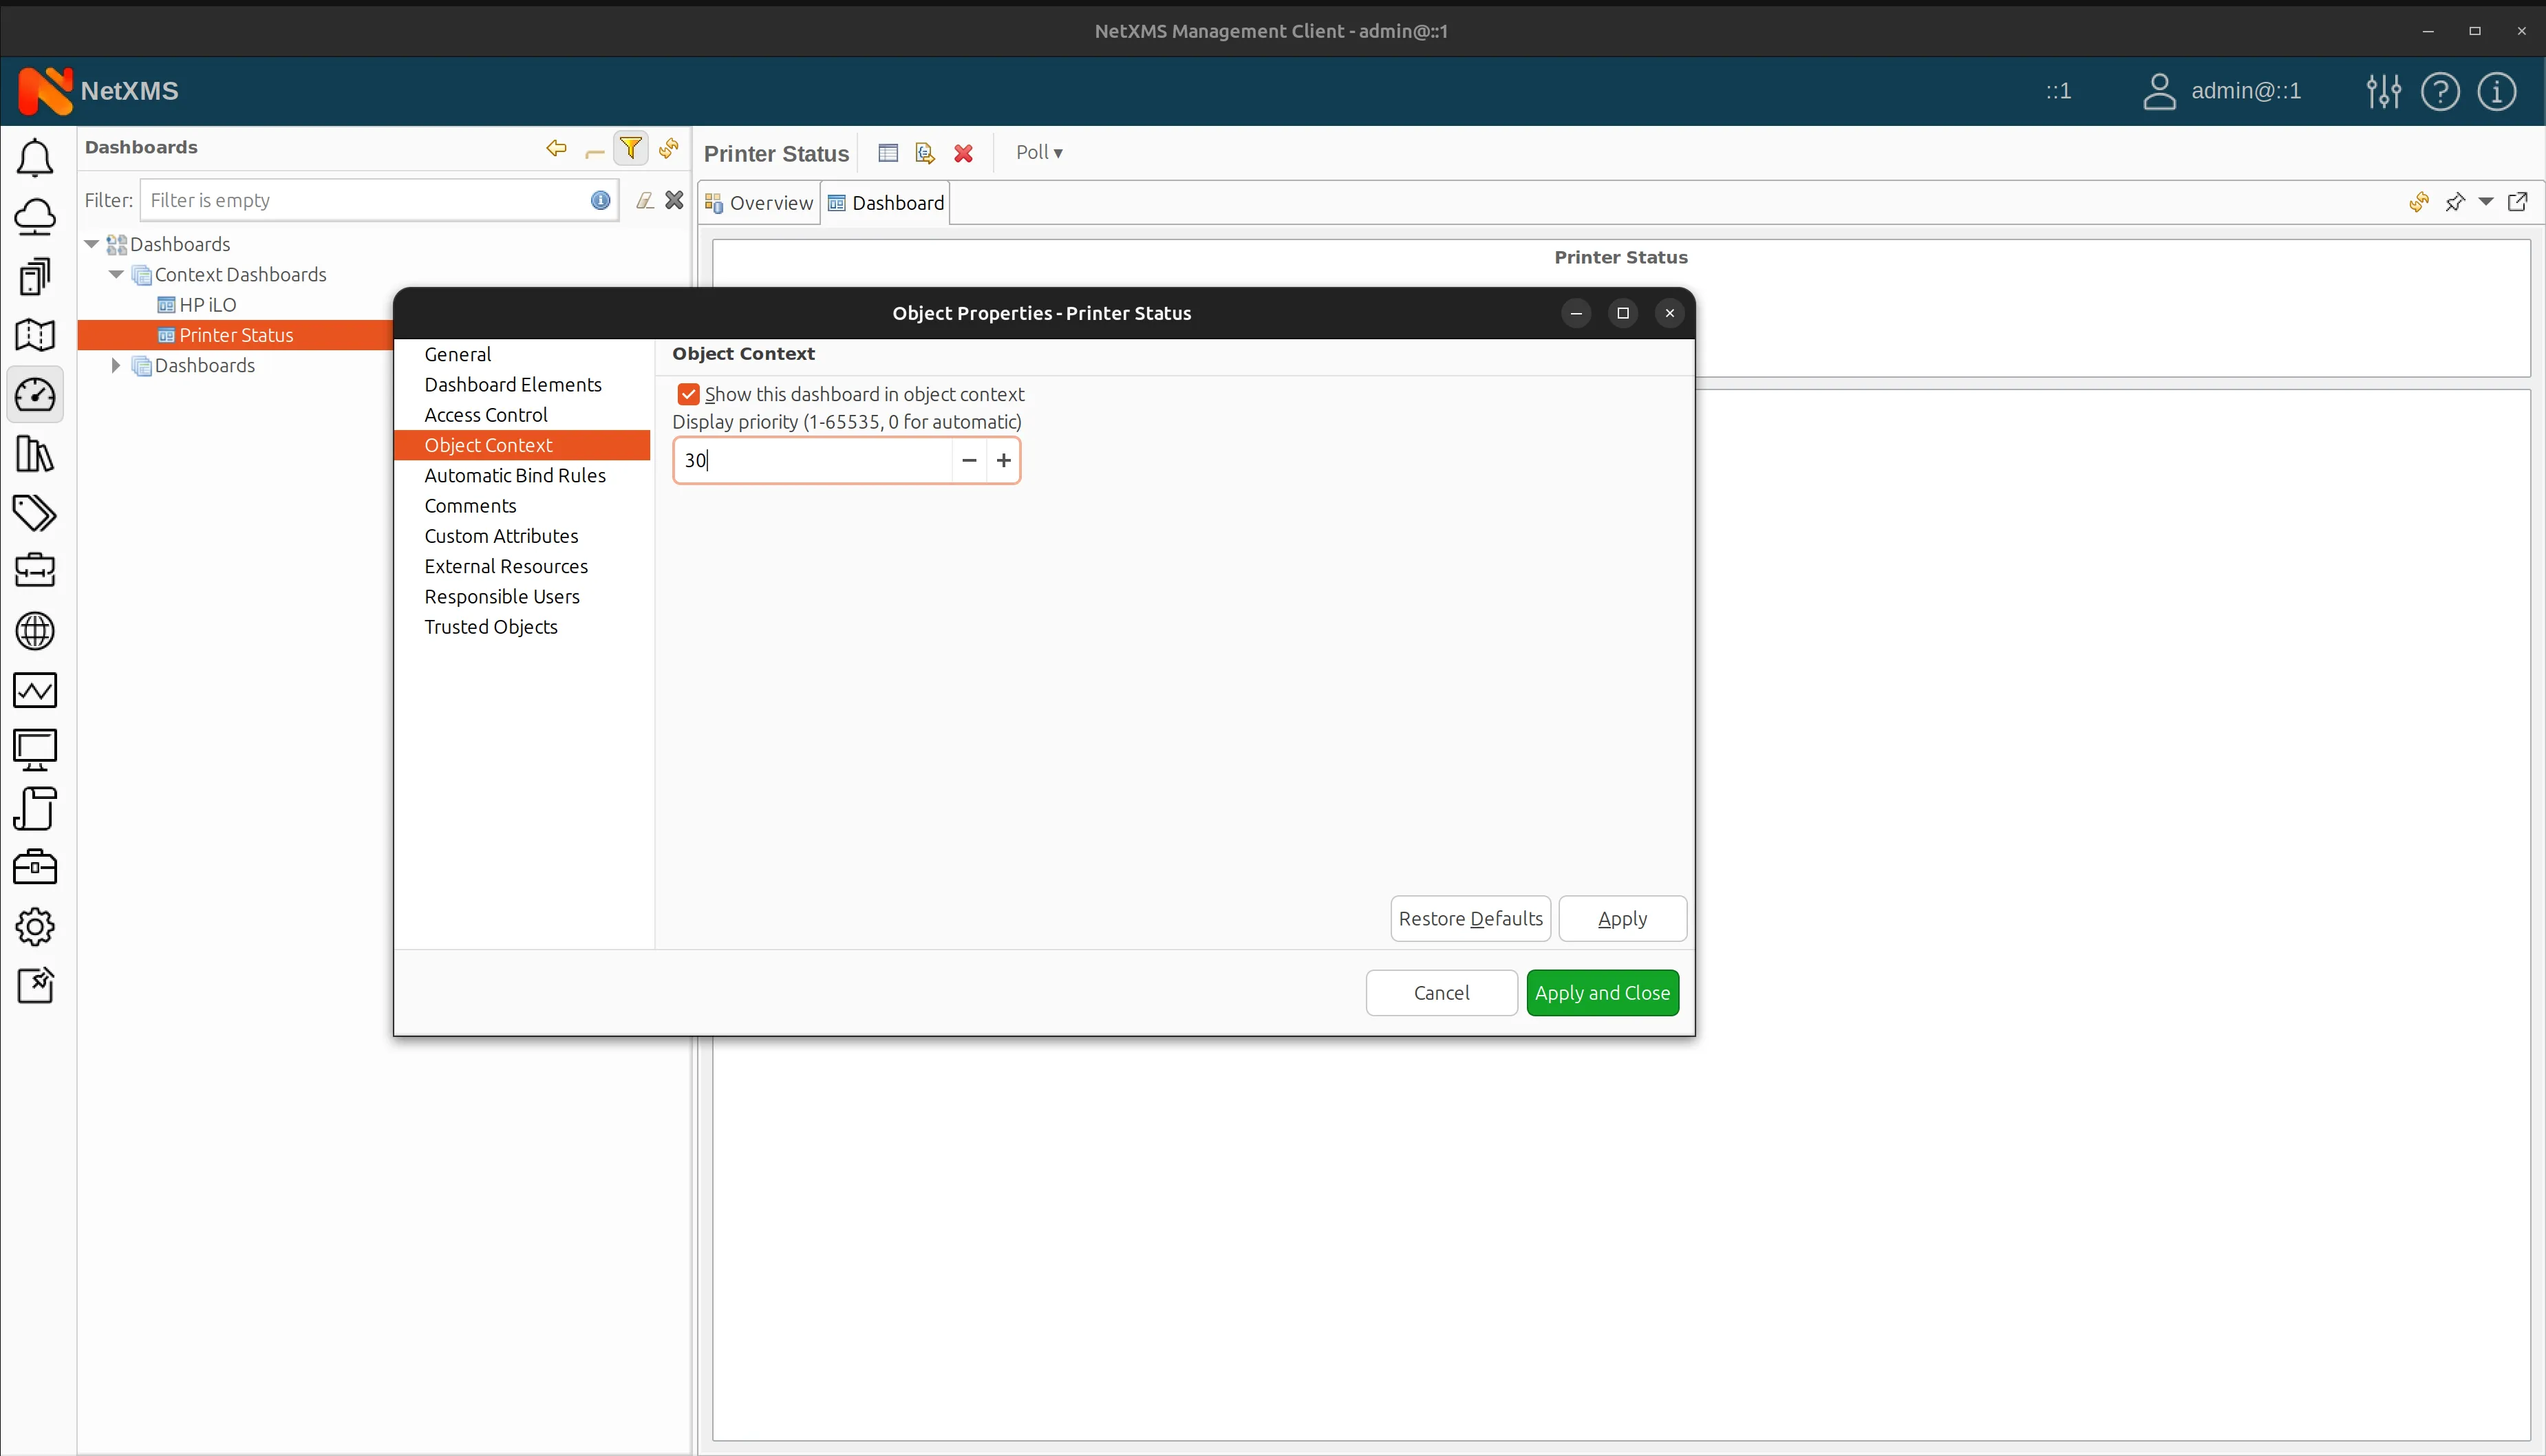
Object context configuration -
Data source templates — users can mix template-based data sources with exact DCIs to display both dynamic and static information on a single dashboard.
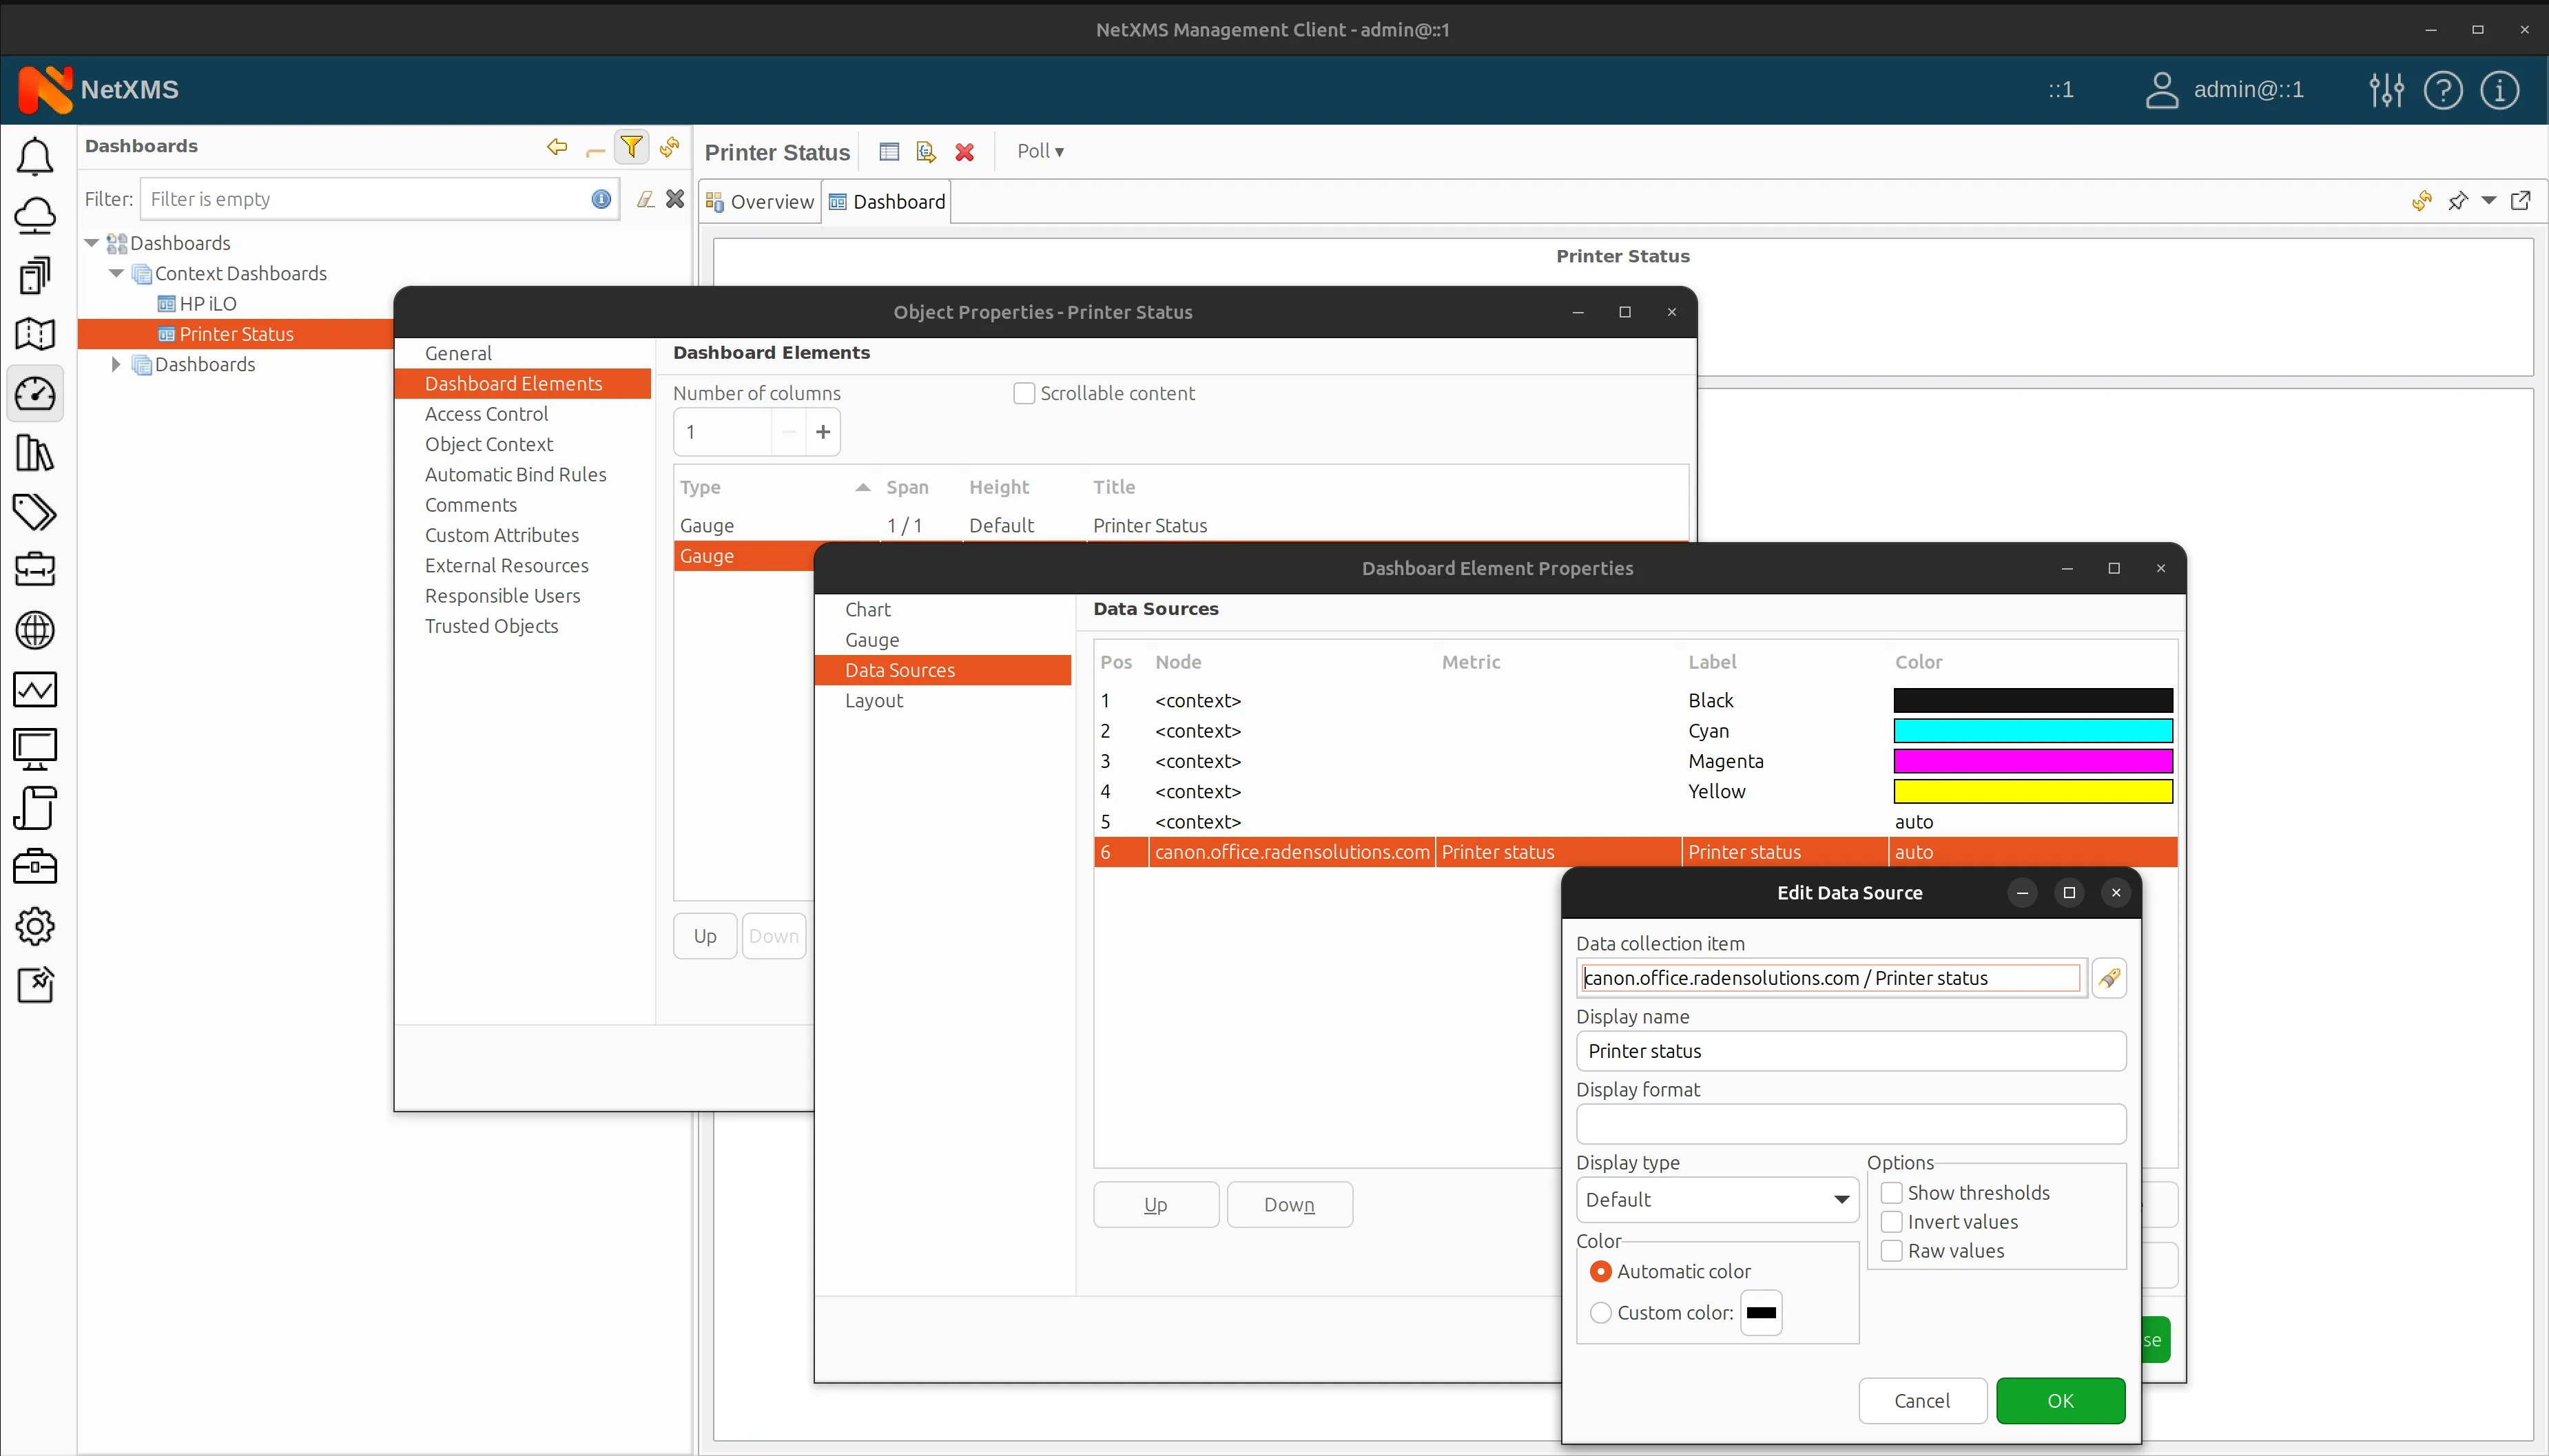
Non template data source usage
Using Context Dashboards in Practice
Let us walk you through a practical example of creating a context dashboard for monitoring temperature and power consumption.
-
Create a dashboard with a line chart for power consumption and a gauge for CPU temperature.
Dashboard element -
Configure the line chart to use a template data source that matches multiple DCIs based on their names.
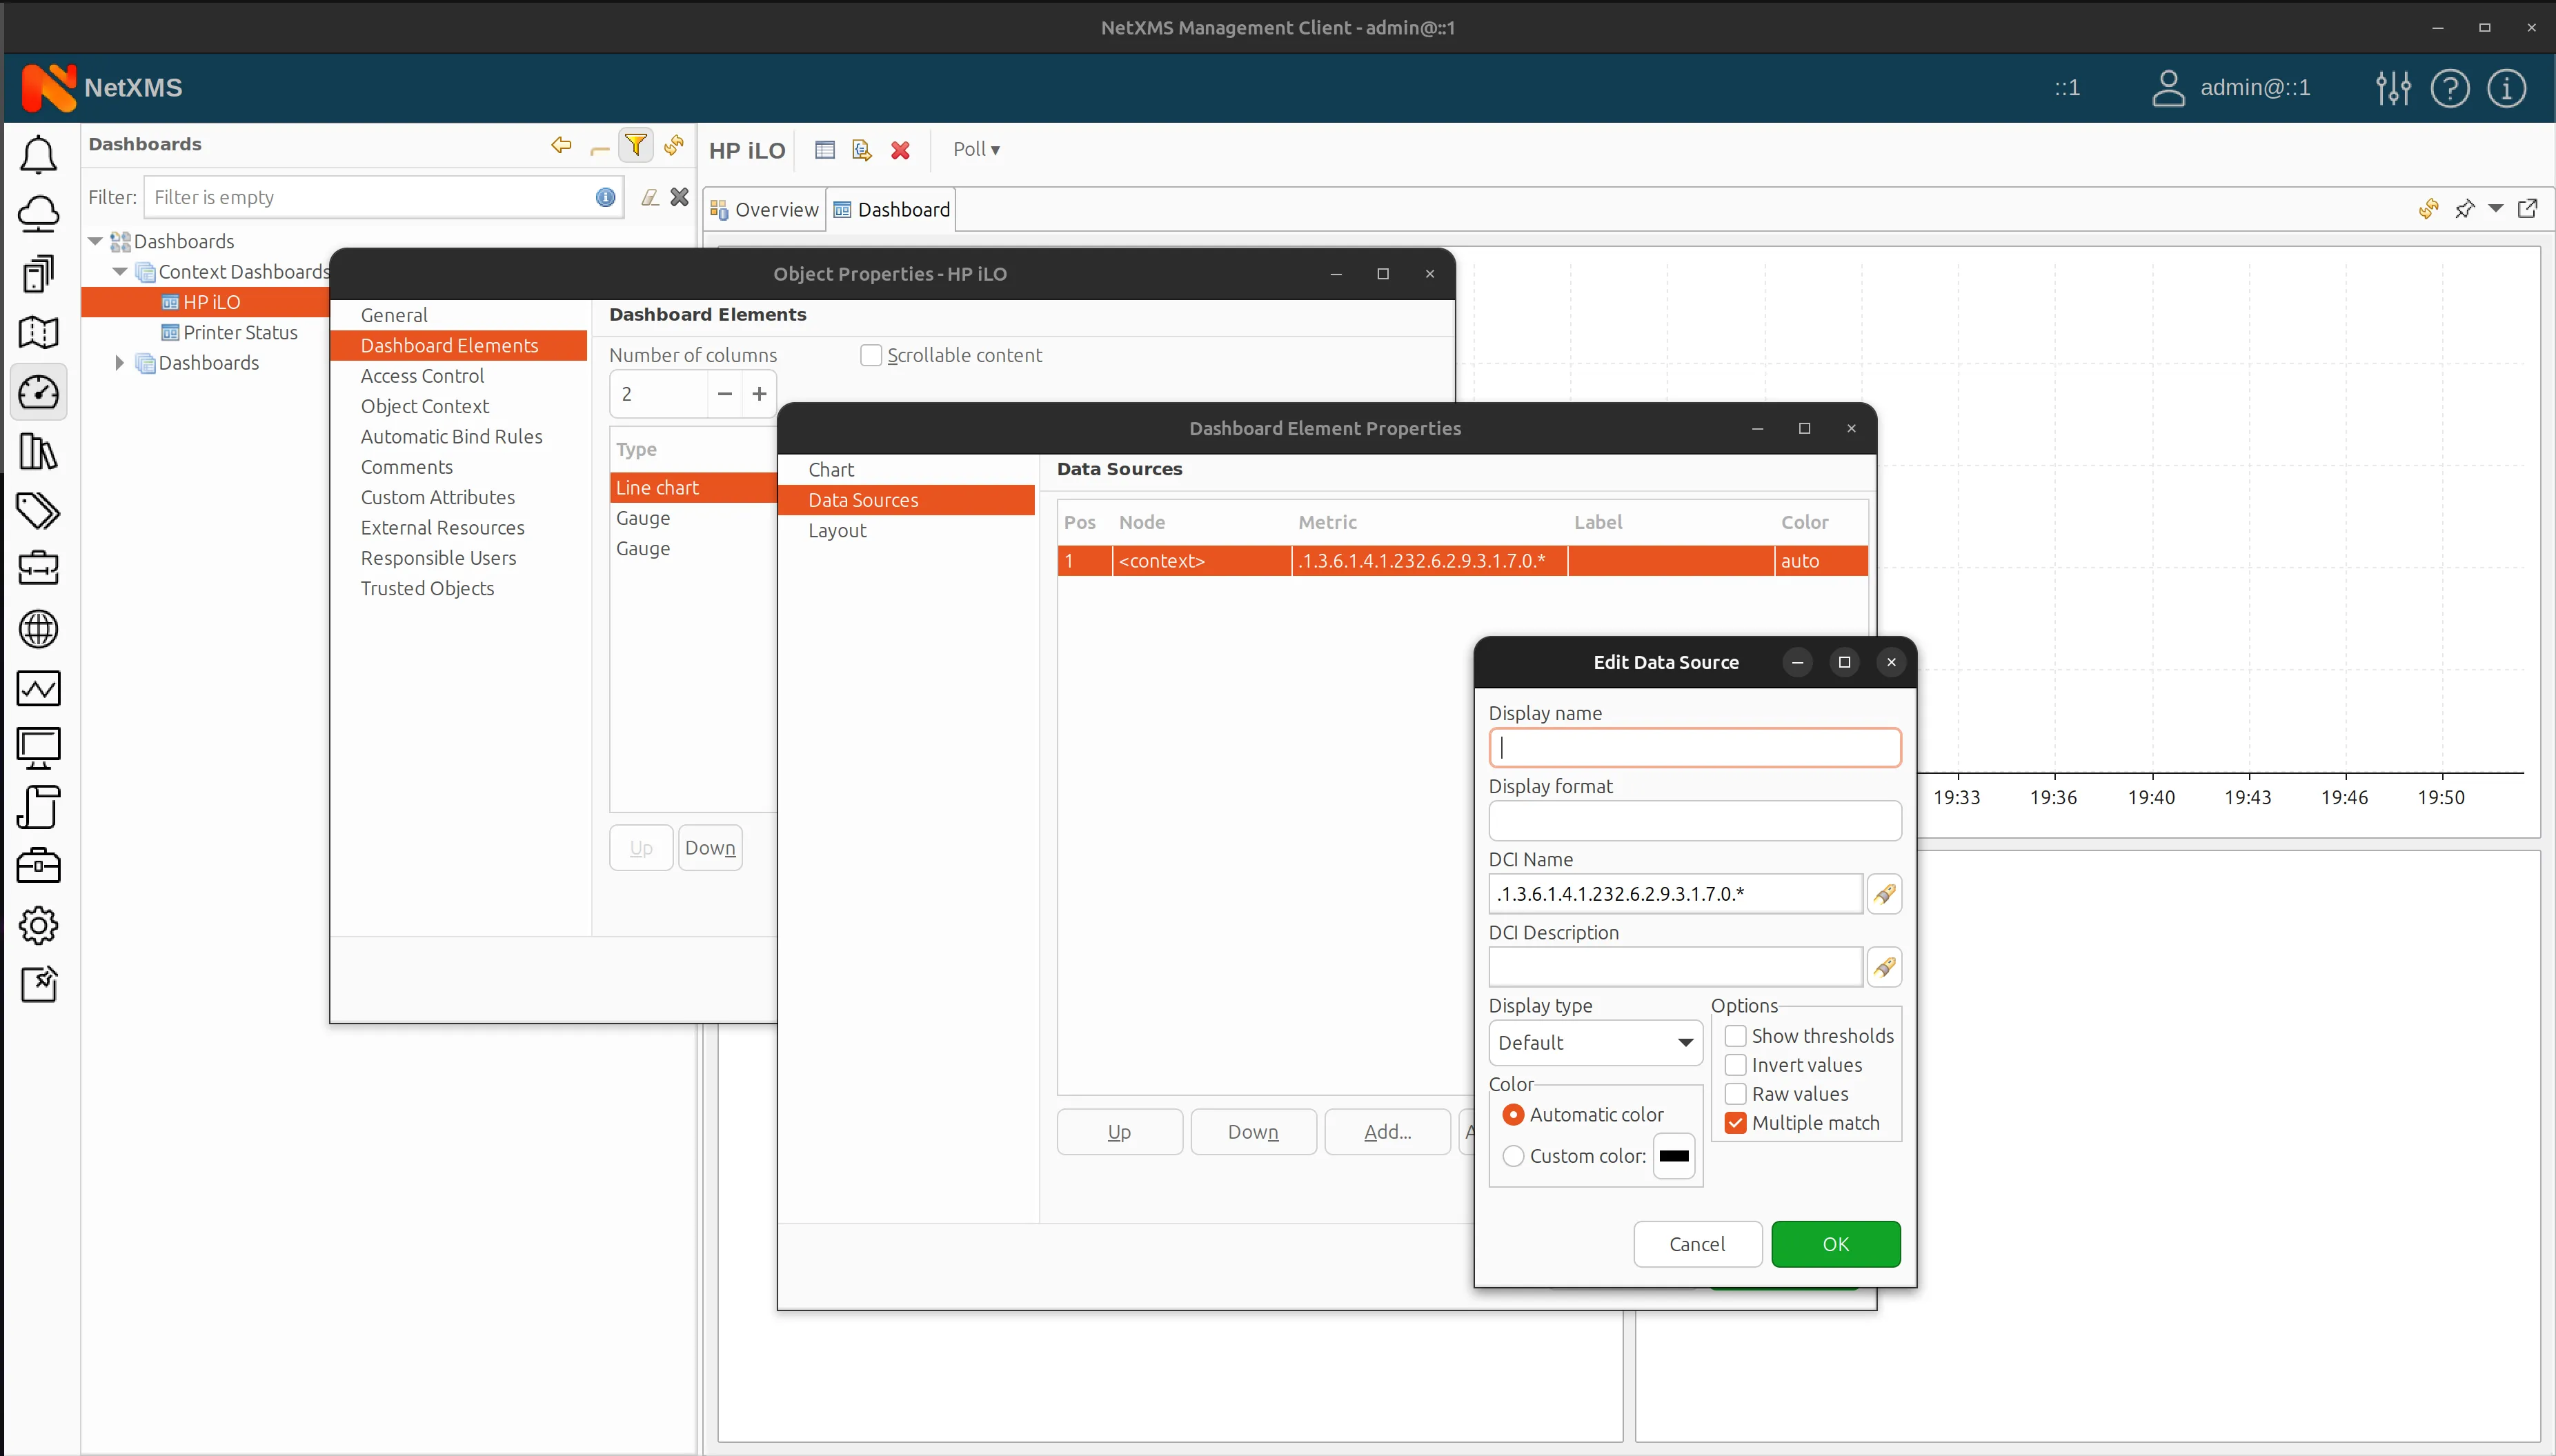
Multi match data shource -
Now, let’s configure the gauge to use a template data source that matches multiple DCIs based on their descriptions.
-
Finally, let’s set up auto-bind rules to apply the dashboard to nodes with specific data collection templates.
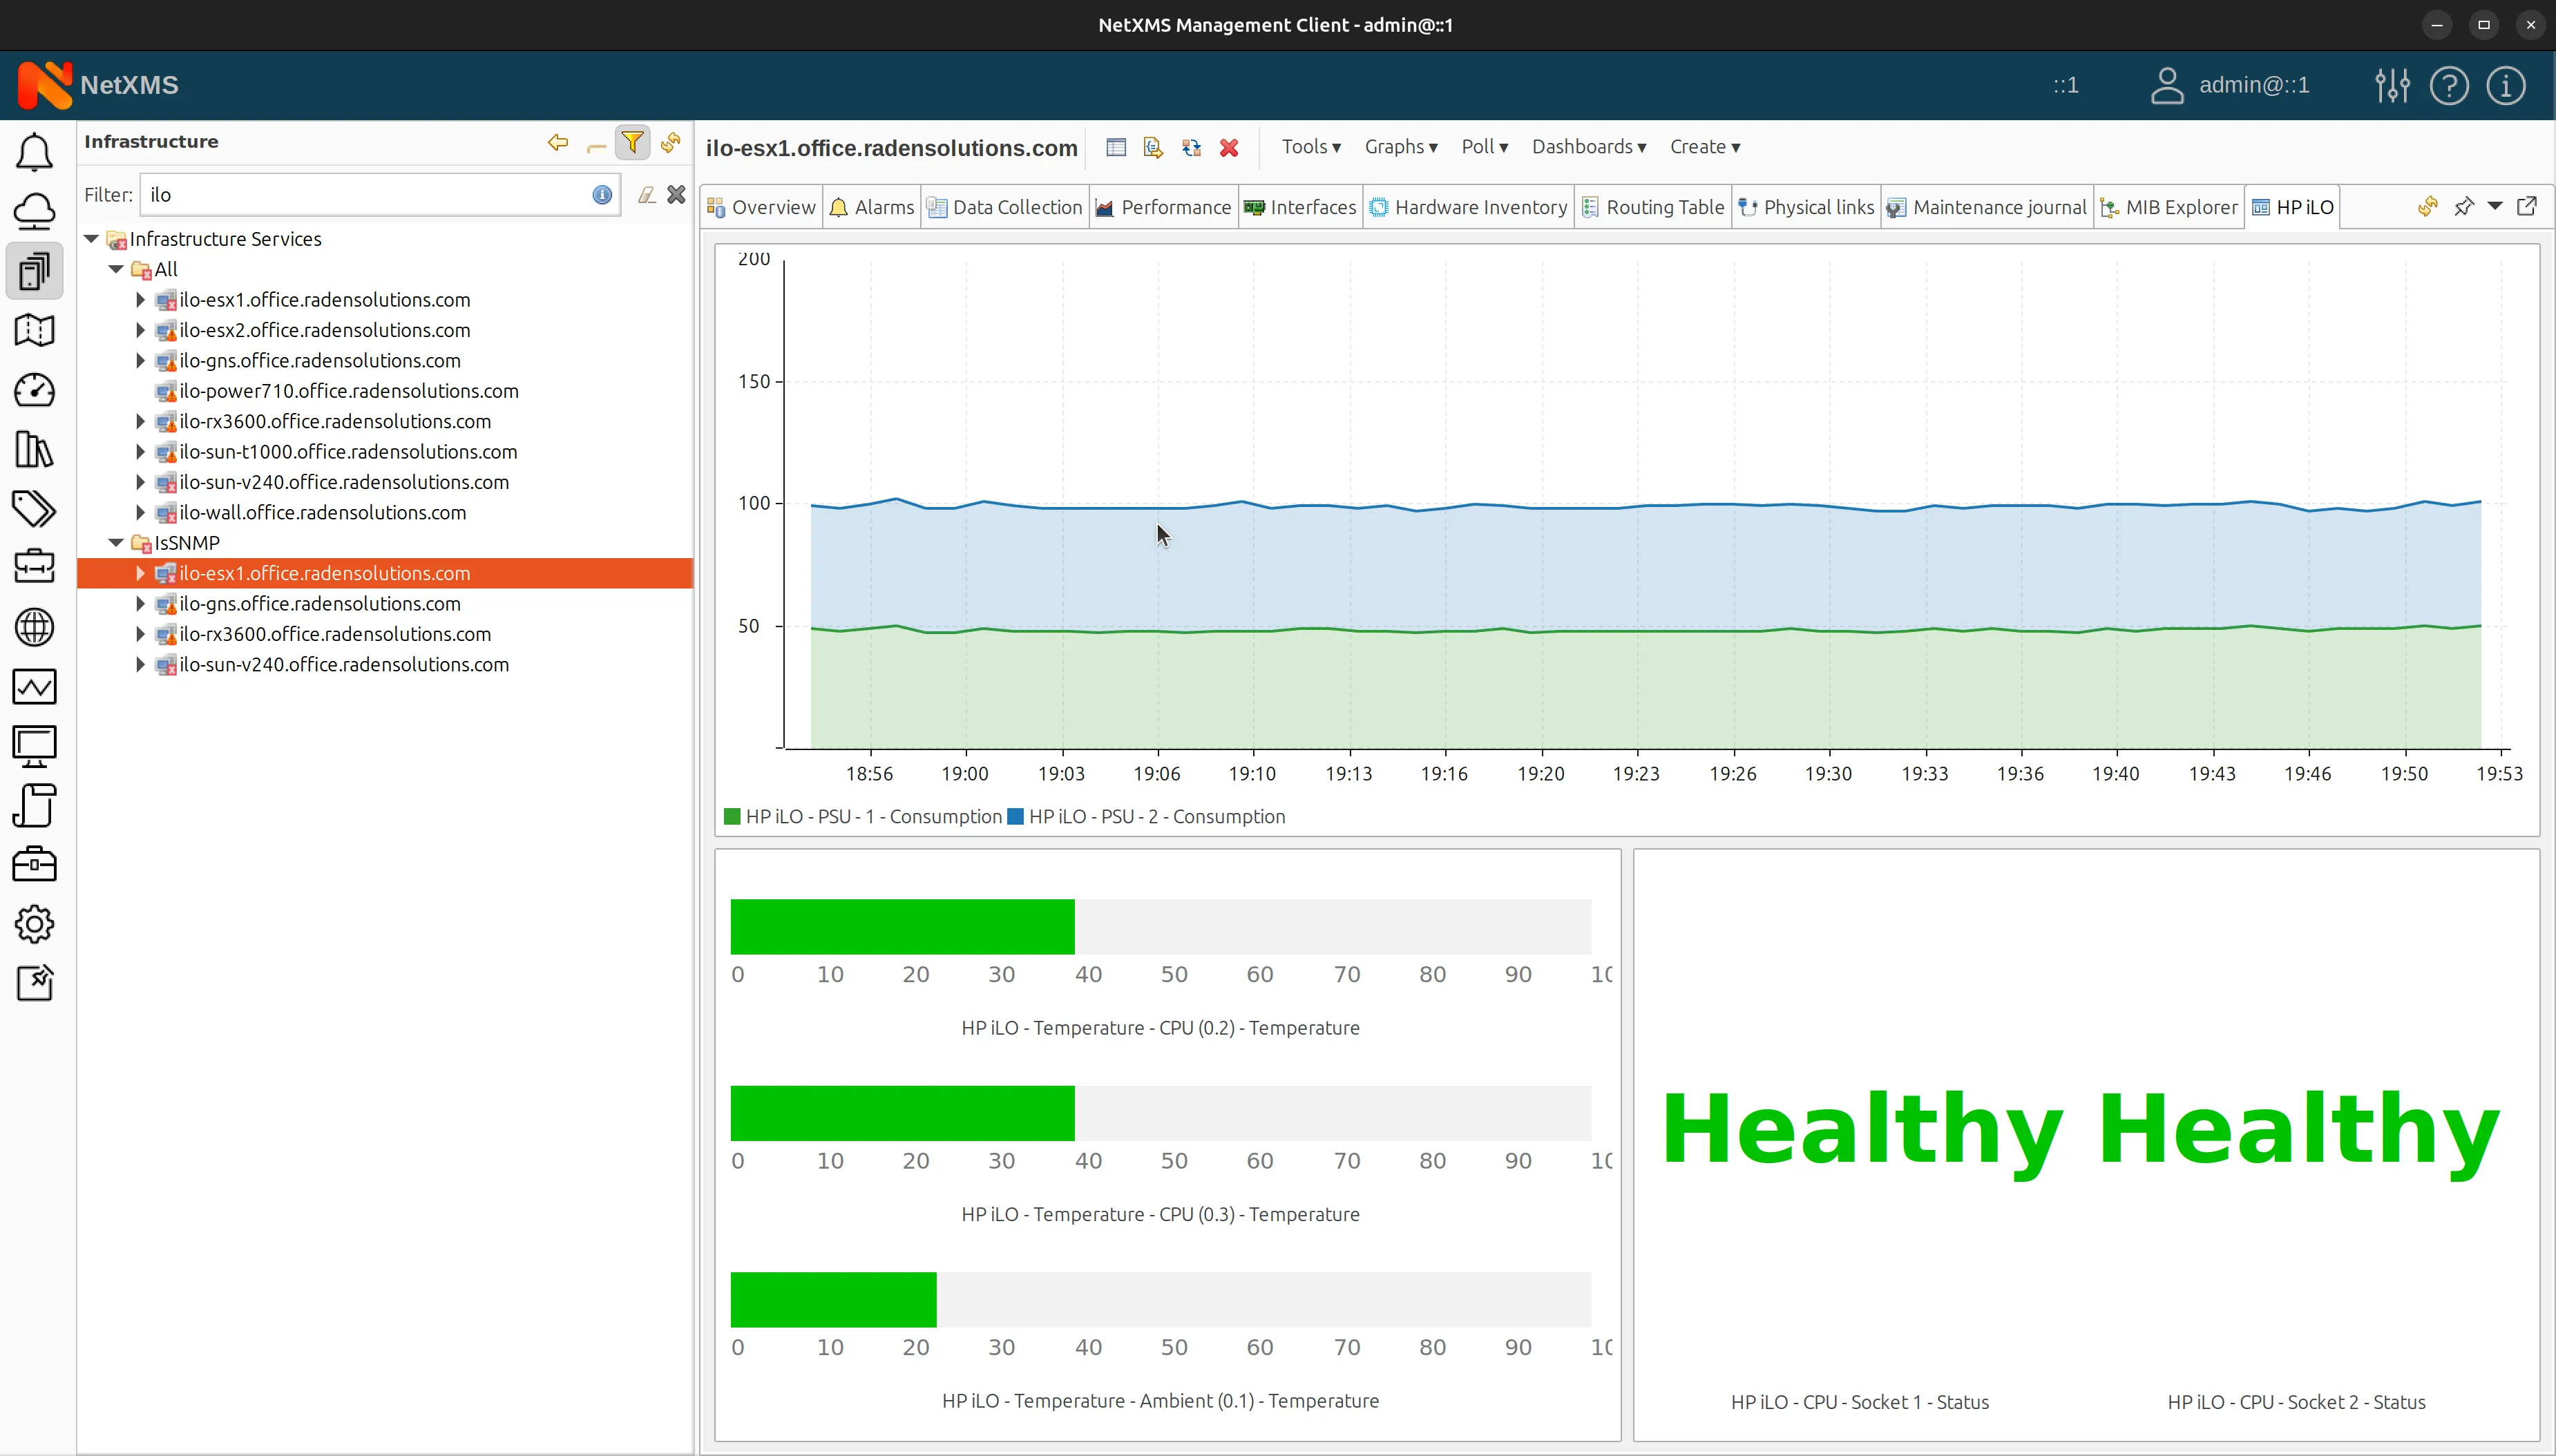
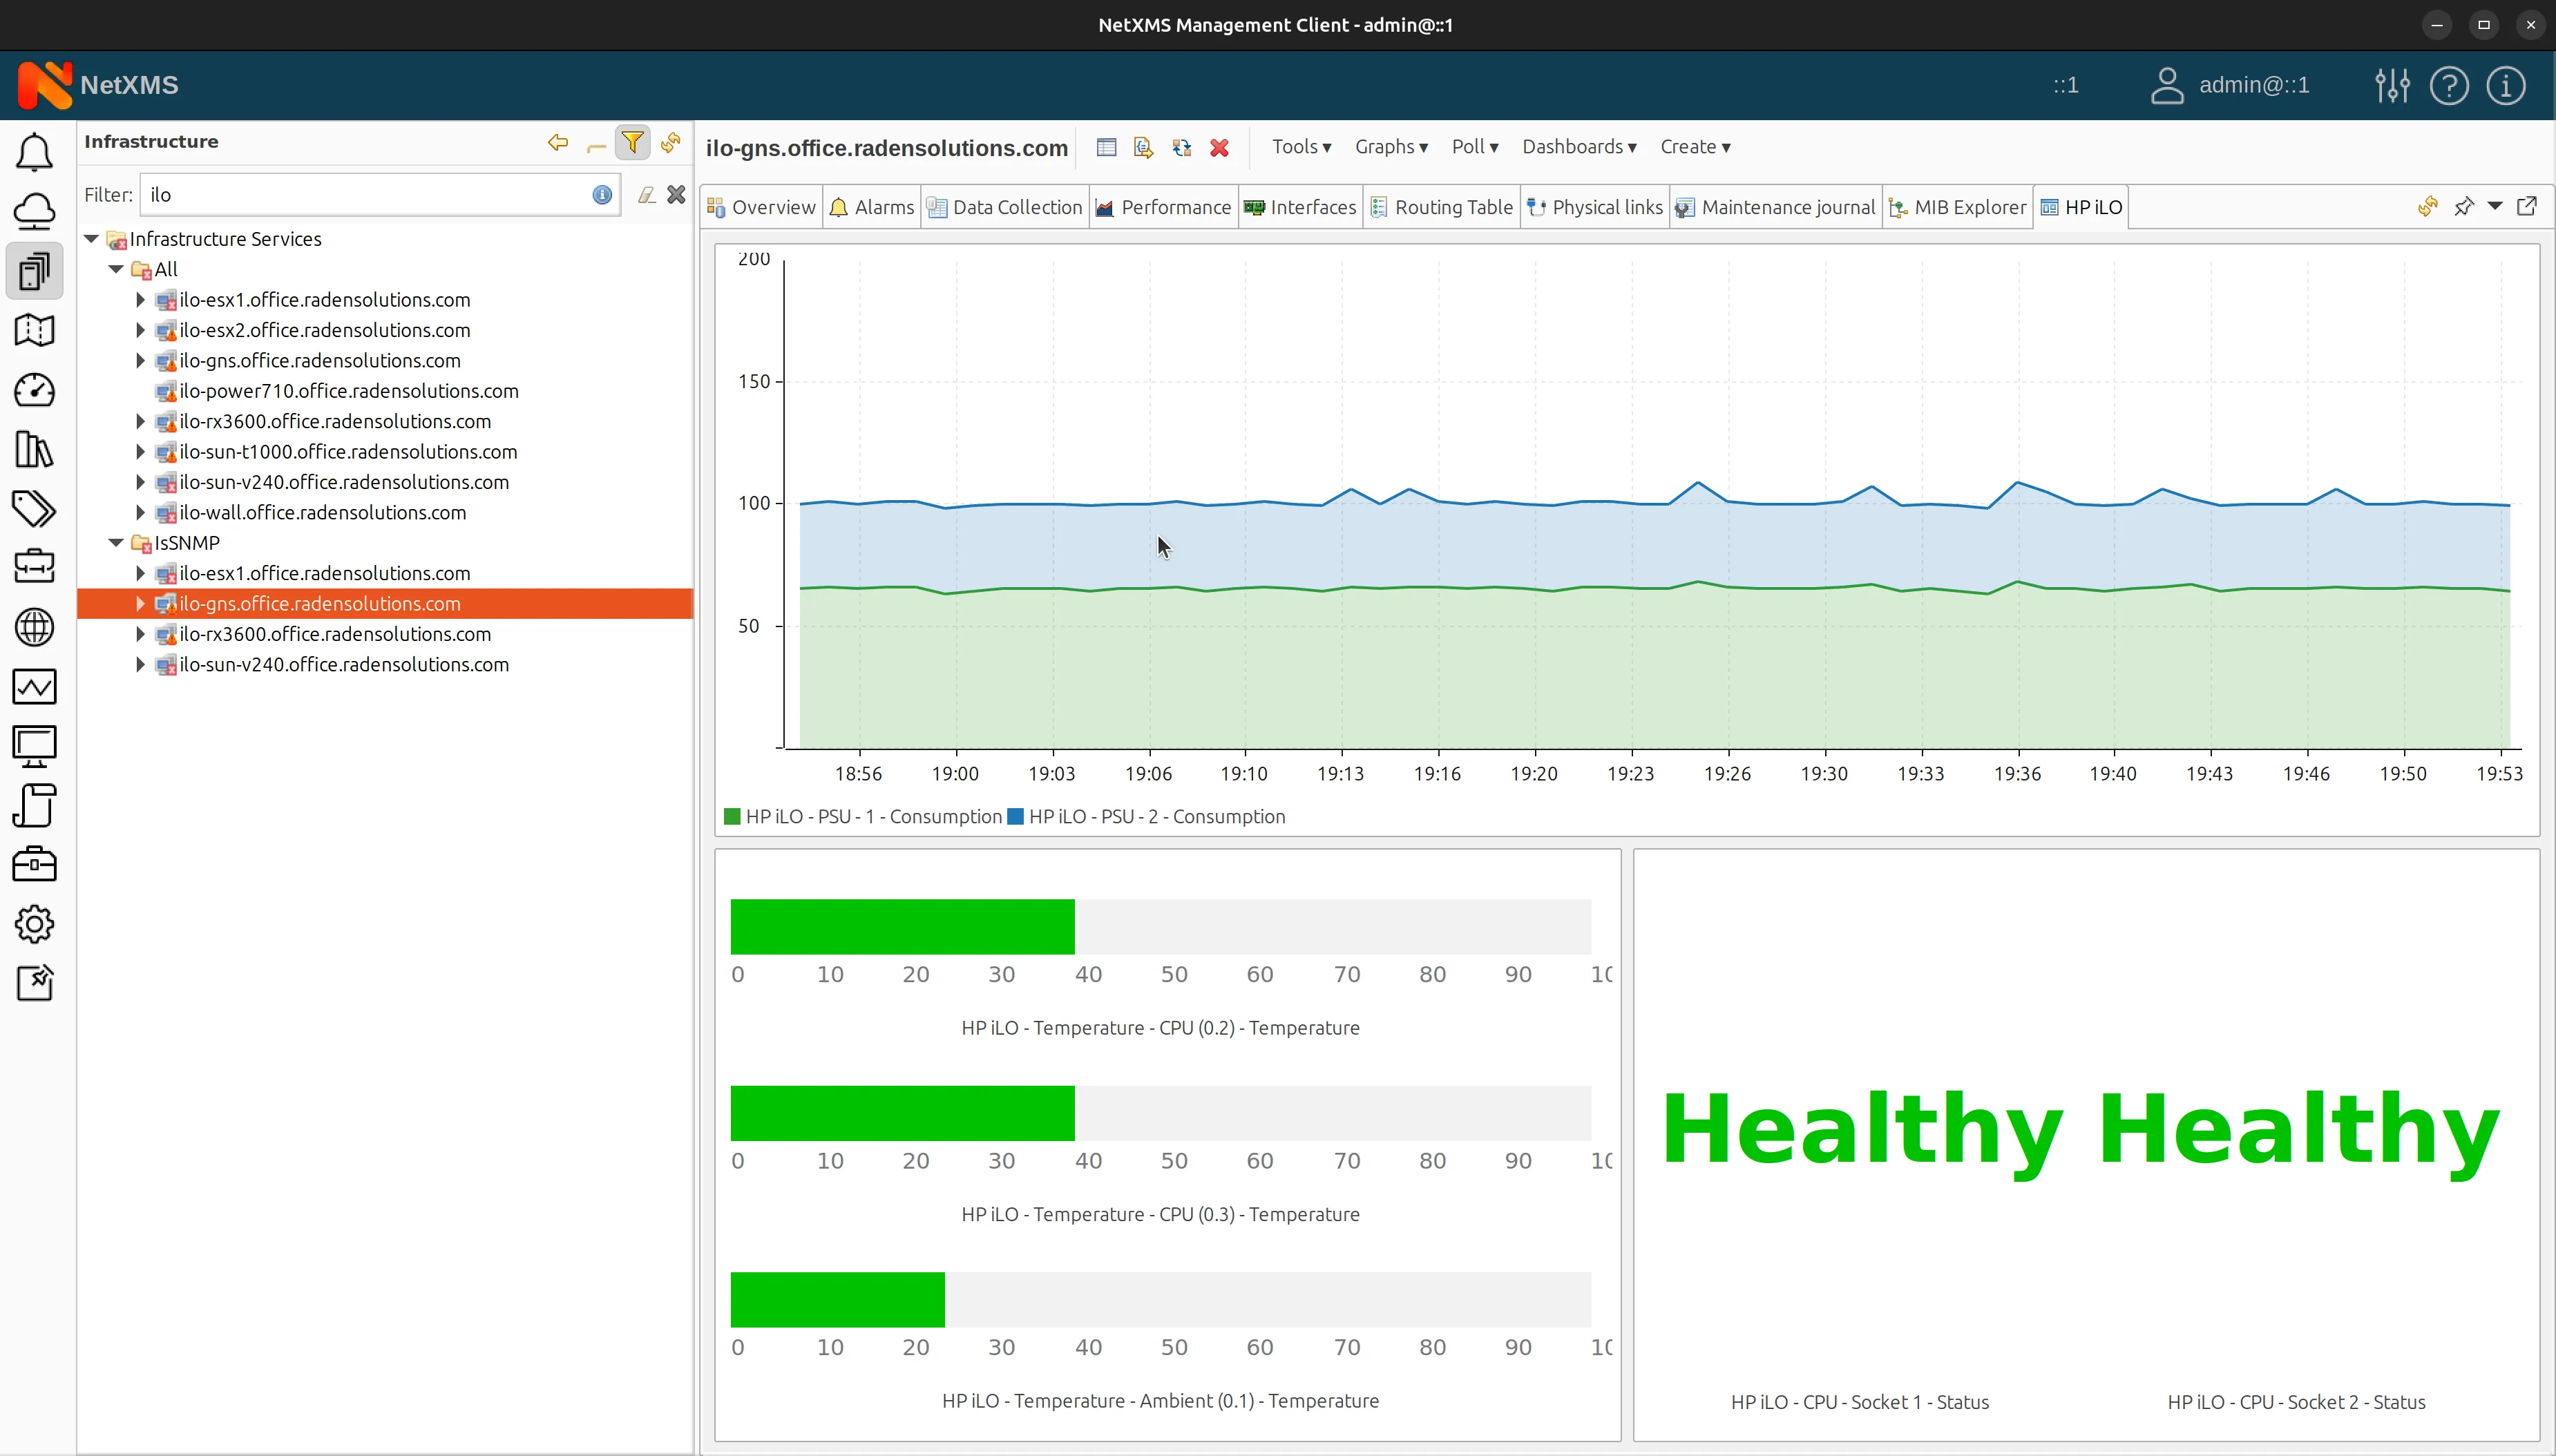
In this example, when a user selects a node with the applicable data collection template, the context dashboard automatically populates the line chart and gauges with relevant data for that node. This dynamic dashboard provides real-time insights into power consumption and CPU temperature, making it easier to monitor and manage network devices.
Context dashboards in NetXMS platform offer a powerful and flexible way to display relevant data for specific network contexts. By harnessing the power of context dashboards, network administrators can create dynamic, insightful dashboards that streamline monitoring and management tasks!
With this new feature, NetXMS continues to improve its platform and provide valuable tools for effective network management.