
What immediately impressed him was that the system offered a fully functional open-source version with Windows support (note from the editor: which is limited to 250 nodes networks since last year). He was looking for a flexible monitoring solution that could help identify and prevent outages before they occurred — and NetXMS absolutely delivered.
Committed to innovating for high-performance, KTM produces a wide range of quality bicycles, including electric bikes, mountain bikes, and urban models. To support its production facilities, offices, and logistics centers, the company operates an expansive and diverse IT network.
Their network comprises approximately 900 nodes, including Windows-based servers, managed switches, and a variety of services.
KTM relies on a Microsoft SQL database environment and is planning to extend monitoring to industrial systems as part of its smart factory initiatives.
We talked to Leopold Esterbauer, now the company’s Senior IT System Administrator, to know more about how NetXMS is used.
Solution that solves problems at hand
The company faced several challenges in their network monitoring that they were looking forward to solving. First, they needed a scalable solution to handle the monitoring and visualization of over 900 (and counting) network nodes effectively.
Moreover, their infrastructure was growing increasingly complex, with both servers and network devices in use.
Another pressing issue was the inconsistency in node naming caused by DHCP environments, making it difficult to maintain a coherent inventory of assets. They also required robust tools for visualizing Layer 2 topology and tracking traffic across the network.
Finally, there was a need to parse and analyze Windows Event Logs effectively for critical event alerts, particularly those relating to Active Directory logins.
While looking for a monitoring tool, the team focused on
- Scalability for hundreds of nodes
- Platform independence (Windows, Linux, SNMP, agents)
- Scripting & automation to reduce manual workload
- Visualization, such as Layer 2 maps and traffic dashboards
- Custom alarm policies, e.g. for login events via Windows Event Log analysis
“Compared to other monitoring tools, NetXMS felt like an admin’s multi-tool: highly flexible, scriptable, expandable — and still lightweight in terms of resource usage. Many other systems were either too rigid or too expensive. NetXMS hit the sweet spot between control and customizability”, Leopold recalls his first impression about the NetXMS.
NetXMS as the Central Monitoring Platform
NetXMS was deployed as the central monitoring platform to tackle the challenges head-on. The system successfully integrated monitoring of all types of devices, providing a scalable and centralized monitoring environment.
The platform’s flexible architecture allowed it to support a mix of SNMP-capable switches, agent-monitored servers, and other networked devices. This foundational capability set the stage for deeper automation and visualization.
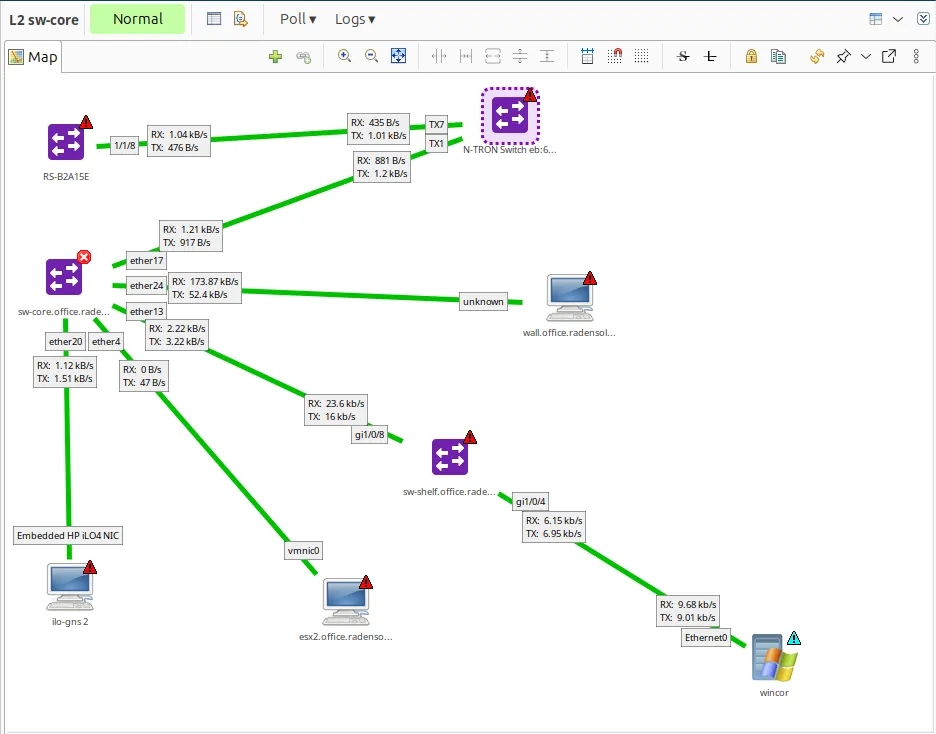
To enhance topology awareness and network visibility, Layer 2 topology maps were generated using a combination of LLDP and FDB data.
These maps provided a dynamic view of the network, automatically updating as devices came online or changed states. In conjunction with these maps, traffic visualization features were enabled through the application of custom templates and styling scripts.
This provided network operators with immediate insights into interface usage and potential bottlenecks.
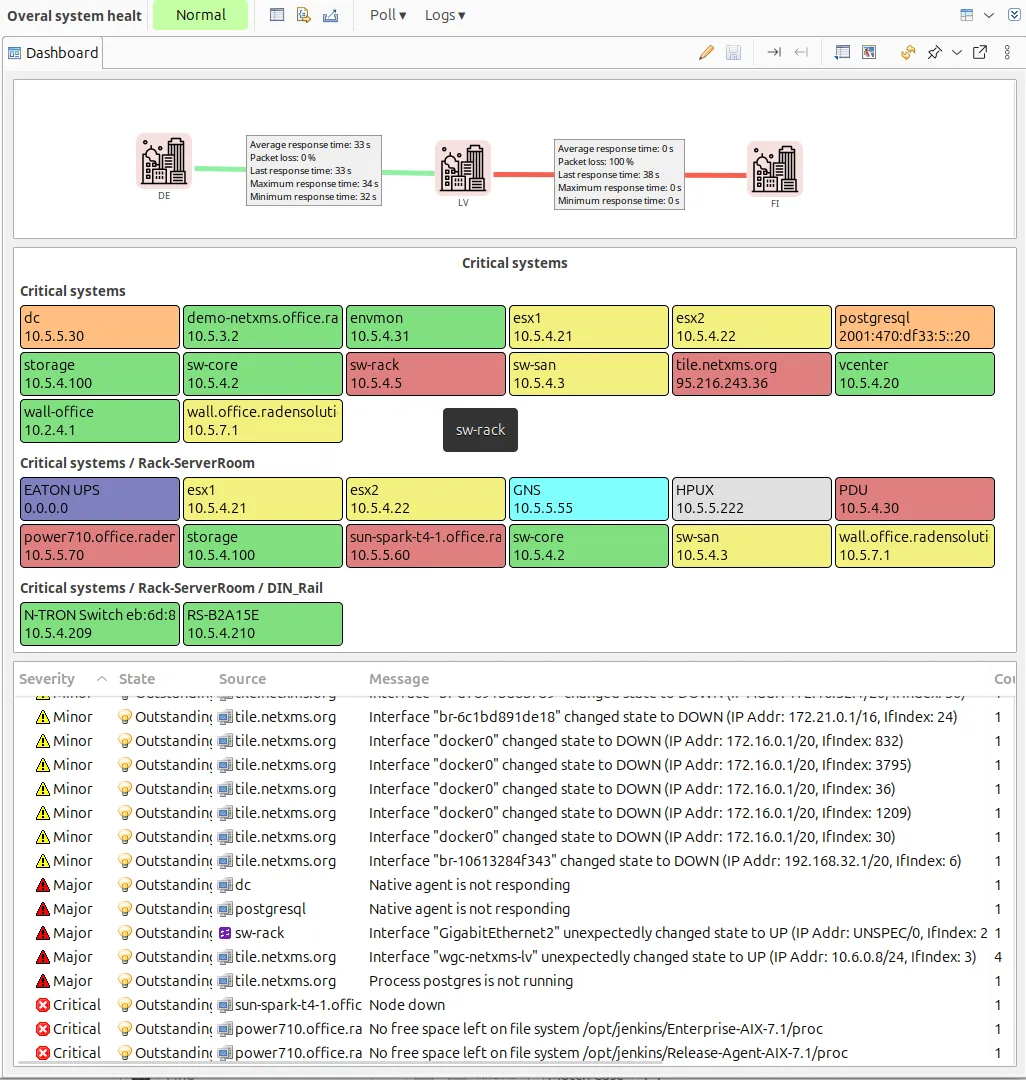
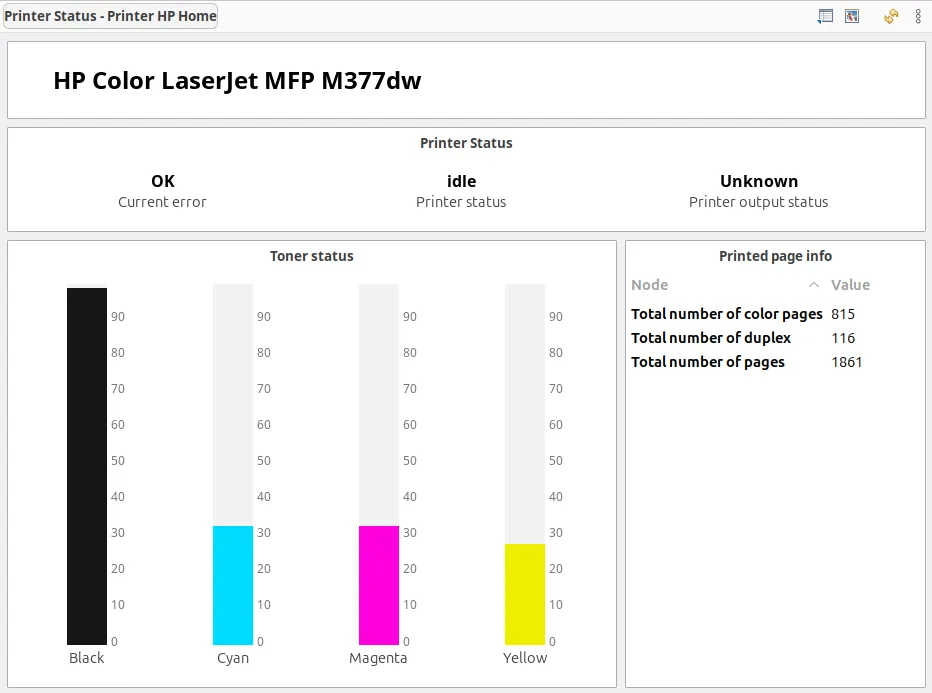
At the moment, KTM’s team uses NetXMS dashboards to visualize data and monitor remote site connections, server status, firewall health, port channels, VPN usage, software inventory, printer toner levels, and of course, Layer 2 maps of our infrastructure.
“It’s a great software, I was using it for years. It’s a real toolbox for an admin.”
Further, DHCP-related naming inconsistencies was addressed through scripting and automation. Auto-bind scripts were created to group nodes dynamically based on subnet and operational status.
Configuration poll hook scripts were then employed to update node names using hostname information gathered via agents. These scripts excluded unreachable nodes to streamline updates and reduce processing time. The result was a much cleaner and more accurate node inventory.
For event and alarm management, NetXMS’s flexible event processing engine was leveraged. Custom event policies were defined to detect and raise alarms based on specific entries in Windows Event Logs, such as login events.
The team employed log monitoring directly on monitored servers as well as log synchronization to NetXMS server for storage and further processing to ensure accurate parsing and parameter extraction. This enabled the creation of targeted alarms with meaningful data, such as usernames and event IDs, helping to pinpoint issues quickly.
Scripting played a key role throughout the deployment. NetXMS’s scripting capabilities were used to automate discovery, customize agent metrics, and resolve DNS inconsistencies.
Real-time troubleshooting and debugging were performed through the platform’s debug console and script execution features. These tools proved invaluable in fine-tuning the deployment and ensuring it met the organization’s operational requirements.

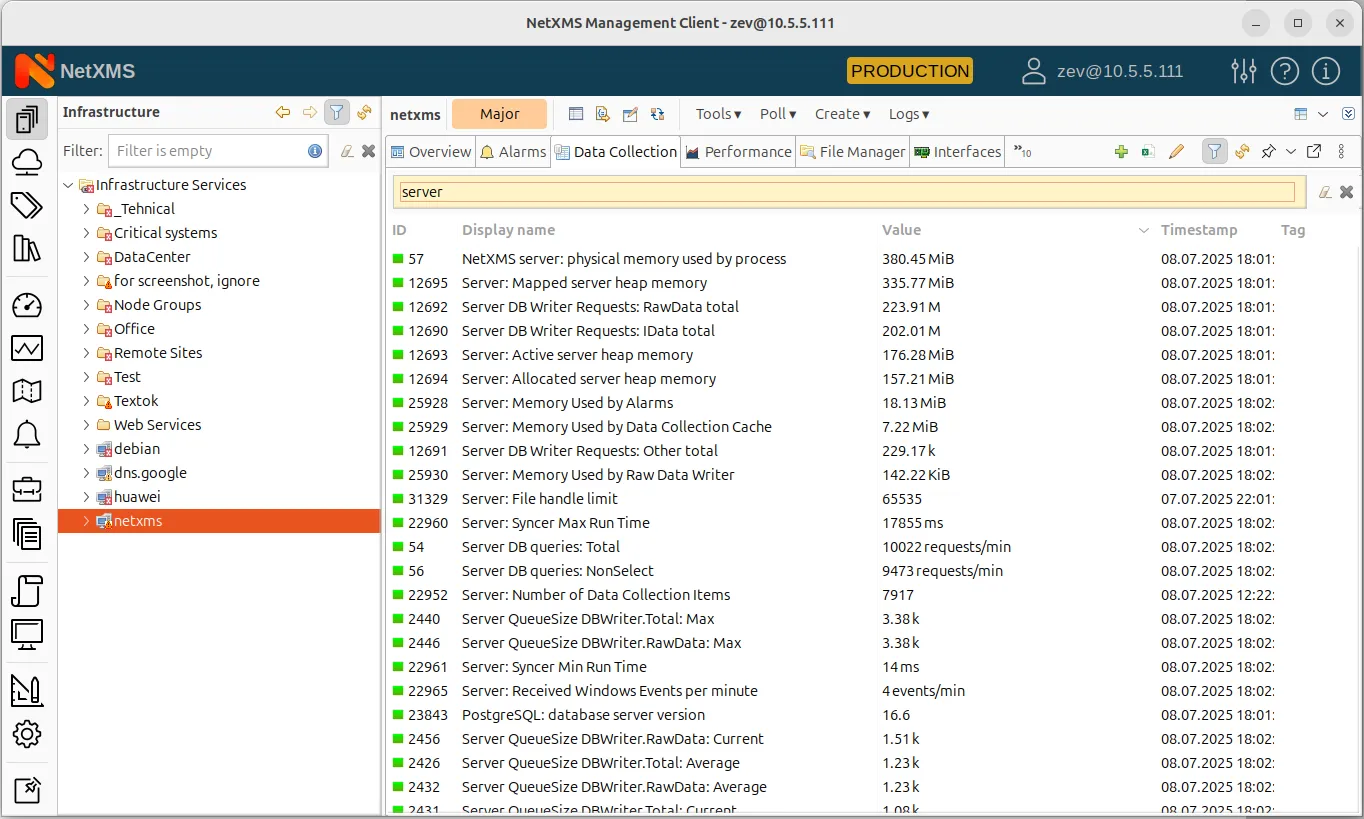
NetXMS’s monitoring also extended to its own server performance. Built-in metrics were used to track event processing rates, database write queues, and thread pool usage. The team identified areas of high activity and adjusted polling intervals using custom container attributes to balance performance and accuracy.
“Was there a particular moment when NetXMS “saved the day”? Definitely more than one! For instance, air conditioning failures, loop detection on switches, critical service outages, or identifying network bottlenecks — NetXMS helped us pinpoint the issues quickly and respond efficiently thanks to a combination of smart alerts and clear visualization,” recalls Leopold.
Plans for further improvements
Additionally, the company experimented with collecting DCI data from business systems like SAP using JSON and XML endpoints, opening the door for deeper business-IT alignment.
In this way, the deployment of NetXMS yielded significant operational benefits. The IT team achieved full visibility over their network with minimal manual intervention.
Real-time traffic monitoring and contextual alarms improved response times and reduced downtime. And the use of templates and inheritance brought a new level of efficiency to system configuration.
“I’d give it a solid 9 out of 10 — it’s an incredibly powerful and versatile tool if you’re willing to invest a bit of time into learning it. The missing “1” is just for the initial learning curve,” says Leopold, giving us even more motivation to enhance our documentation files and learning materials.
Looking to the future, the organization began preparing for integration of industrial hardware by exploring NetXMS’s support for protocols such as Modbus TCP and Ethernet/IP.
The ability to customize extensively via scripting transformed NetXMS into a powerful administrative toolkit.
NetXMS provided the flexibility, scalability, and depth required to manage a diverse and growing IT infrastructure.
Whether dealing with legacy equipment, modern traffic analytics, or planning for future industrial integrations, NetXMS in this case proved itself as an indispensable tool for KTM Bikes network administrators.